Slidegenius, Inc.

8 Ways to Maximize Engagement in Internal Communications Presentations

Are big changes happening in your company? How will you spread that information to every employee?

The success of your business depends on your effective communication skills as a leader. Simple emails and memos don’t inspire. The challenge lies in engaging your employees.

Effective internal communication creates a more unified front throughout your company. With everyone on the same page, you can guarantee you are all working toward the same goals.

At SlideGenius, we specialize in professionally designed PowerPoint presentations. We fully believe in the power and capabilities of visual storytelling.

Our expertise with PowerPoint has helped over 3,000 clients worldwide, boosting their communication internally and externally.

We design every presentation with the intent of creating engaging material to generates positive results for you.

The following are some tips on how you can boost the effectiveness of your internal presentations:

Disseminate Presentations to Each Department

Tailor versions of your presentation for the context of each department. It will consume more time and effort, but ultimately, this hard work maximizes the relevance of your presentation in the audience’s eyes.

Broad presentations may save time, but they sacrifice delivering a focused message for something quick and easy. Don’t set a bad example. Do it right the first time.

Tell a Story

Even within the context of seemingly mundane businesses or industries, injecting storytelling into your presentations can make them more compelling and engaging. It’s the difference between your audience staring at their feet and watching your every move.

The goal of storytelling is to get your audience to relate with the information being presented. The more people can grasp what’s being told to them, the more they are able to follow the flow of your discussion until the end.

Provide Concrete Examples

People latch onto information more easily when it’s clear-cut and definitive. Vague statements regarding your company’s improvement or decline fosters disinterest. After all, how can anyone improve a situation they can hardly imagine?

Case studies are great examples of concrete information. Don’t be afraid to bare the nitty-gritty with your employees. It’s this data that will prove you are the authority on the subject.

Boost Company Morale

Your presentation isn’t only meant to update your employees on things happening in the company and the market. Treat these meetings as opportunities to express your gratitude to those who made the goals achievable. Connect to people broadly, but also individually. Feeling seen not only makes them more inclined to tune into what you’re saying, it will put them on their best behavior afterwards.

When you boost a person’s confidence in their work, it will increase their motivation to improve.

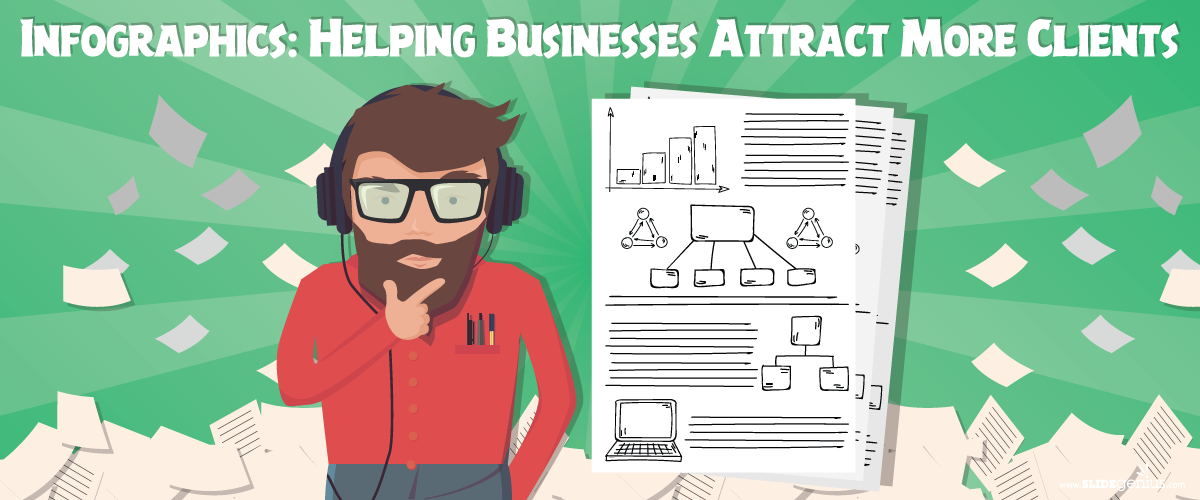
Use Professionally Designed Infographics

Make the most out of your data by presenting them with a unique visual twist. People are more likely to process and retain visual information better than simple text and numbers. A well-made infographic has the power to transform even ordinary bits of data into engaging materials.

Encourage Audience Participation

You may be the lead presenter, but the presentation does not need to be a one-way street. Invite your employees to ask questions or provide feedback during your presentation to include them in the discussion.

This involvement helps promote a feeling of inclusivity and transparency that will be appreciated by your employees. It’s also a great way to remind them that there is an opportunity to practice teamwork in every setting.

Provide Handouts

Handouts will help your audience keep track of everything that’s being talked about, especially for heftier presentations. Employees will be able to take those handouts with them as accessible resources of information.

Most people will not absorb all the relevant information the first time around. Allowing people to hold onto this info will give them more time to process it, absorb it and increase your chances of making a longer lasting impression.

Make Your Presentation Available Online

There will be cases when some members of your organization will not be available for your presentation. Having an online version of your deck ensures everyone will get to see it when they can, and even review it if need be.

As you continue this practice, you will be building an increasingly invaluable source of knowledge and value as well as increasing your own profile.

SlideGenius Prepares Presentations for You  

When there’s too much work on your hands already, partner up with us and we can design your next internal presentation for you! From PowerPoint presentations to animated videos, we professionally craft presentations to boost communication skills and internal messaging.

Our dedicated work is possible because of our team of passionate presentation designers, writers, and animators. We continuously develop our skills to provide every client with exciting and unique presentations that meet the world-class standards.

We’ve helped countless clients raise their company’s profile internally and externally. We can do the same for you! The growth of our clients is our greatest measure of success. Together, let’s elevate your company further through the limitless possibilities in PowerPoint!

Reach out now to get a free quote—contact us today!

The Real Cost of a Poor Presentation

The truth may be more prevalent than you would like to admit, but it’s unhealthy to ignore the fact that there are good presentations, and there are also bad ones. If you could give an estimate, how many from the total number of existing presentations are poorly made? Around 50 percent? That’s a big number. Assume for a second that, around the world, there are over a billion PowerPoint files today. That’s 500 million at the very least.

With all the design and content tips littered all over the Internet about making the best pitch deck, you’d think that by now, everyone can create decent slides. But let’s not get too idealistic. PowerPoint is tricky to master, especially when you consider how people have different reactions to presentations in general.

Should you cater to their wants then? “Yes” would be a short answer, but it has serious implications for your succeeding attempts at presentation. For example, when you’re creating a pitch deck. You can’t make a one-fits-all since it’s practically impossible to create slides according to the preferences of every executive you’re looking to impress. It’ll be a mishmash of different styles, and that can be distracting.

Does it mean that this is a hopeless case? Of course not. The best you could do is minimize the negative effects of a bad pitch deck presentation, like death by PowerPoint. Other suggestions are doing your best to create the most visually appealing deck people will ever see or hiring a good team of presentation specialists to make awesome slides—as long as you avoid using poorly designed presentations. Why? Because you stand to lose more than just cash by crafting pitch decks or sales presentations sloppily. The infographic below will help you see that you shouldn’t be worried with just your profit margins because you put at risk something bigger than money.

Resources:

Griffith, Eric. “17 Tricks to Master Microsoft PowerPoint.” PC Mag. October 14, 2014. www.pcmag.com/feature/328357/17-tricks-to-master-microsoft-powerpoint

Looking for creative presentations that can leverage your business? Enjoy free PowerPoint templates from SlideStore! Sign up today.

Infographic Dissection: Parts that Make Up a Good Infographic

A quick look at multiple blogs will reveal an amazing truth: infographics are all the rage for the past few years. Why wouldn’t they? They make complex concepts easily understandable and, generally speaking, make life simpler. On a lighter side, they’re quirky and fun—almost entertaining—to read.
Infographics, a portmanteau of the term “information graphics,” is not a new concept. From the late 18th century onward, information graphics have made data more visual and more appealing for study. As such, the tedious task of studying countless tables to compare numbers and figures became as simple as looking at graphs and/or charts (which, by all rights, are methods of data visualization). Today, most infographics are intended mainly for information dissemination, shareability, and traffic management.
This is not bad though; in fact, the statistics back it up. Infographics are liked and shared thrice more than any other visual material online. The very nature of the medium and the fact that they make tons of information easily understood (without wasting a good chunk of your time) make them likable, which adds to their popularity. Added to that is that humans are visual creatures, and you’re looking at one of the two most effective and most efficient methods edutaining; the other is video (think documentaries and the like).
In that surge of popularity, many people tried their hand at making infographics. Some came out great, while others aren’t. It’s unavoidable: Mass production usually results in poorer quality. While there are still some that stand out among the sea of mediocrity, it’s better to be reminded every now and then of what makes for a good infographic.
Although it’s not that difficult in theory, in practice, it can be very different. You need skills and excellent planning to pull it off. But if you’re confident that you can create an amazing infographic, remind yourself of what you need to put in your piece. Let the infographic below be your checklist on the what and the why.

Resources:

Taylor, Marcus. “The Anatomy of Creating a Great Infographic.” Venture Harbour. n.d. www.ventureharbour.com/the-anatomy-of-creating-a-great-infographic
“10 Types of Visual Content to Use in Your Content Marketing.” Mass Planner. October 21, 2015. www.massplanner.com/10-types-of-visual-content-to-use-in-your-content-marketing

Design Hacks for Designers on a Deadline

Graphic design is expanding. Every year, new designers emerge—many of which are equipped with skills that match, if not surpass, that of established professionals. If you don’t want to be replaced, strive to be more valuable. Identify yourself from the crowd by being consistent with the quality of your work. Excellence is important for artists like you since your job entails producing creative outputs that spark the imagination. To be a great designer, you need to make sure that your designs don’t stagnate and lose their luster over time.
Quality is indeed number one in the list of things that should define you as an artist. However, it doesn’t end there. Since the design marketplace teems with designers who produce exceptional work, quality is no longer enough. You need to add another ingredient to the mix.

The Missing Piece in the Puzzle

What design skill is so important that, without it, you won’t be able to outshine others in your field? Why, speed, of course. With the upsurge of client demands, there’s nothing more sought-after today than a designer who can produce quality work within a short time frame. Time is money—the faster you work, the more you’ll earn. It’s as simple as that.
Still, we’re no strangers to the conjecture that quality takes time. You can argue that speed comes at the expense of quality, but if you give it enough thought, you’ll see that this isn’t really the case. There’s a difference between a fast output and a rushed one, and obviously, you should aim for the former. Lighten your workload by applying some tricks of the trade that will enable you to work faster.
The following infographic provides some advice on becoming a better and faster designer. Integrate these hacks into your work process, and never miss a deadline again!

Resources:

Beachy, William. “How to Become a Faster Graphic Designer.” Go Media. June 24, 2015. gomedia.com/zine/insights/how-to-become-a-faster-graphic-designer
Cousins, Carrie. “How to Become a Faster, More Efficient Designer.” Design Hack. June 21, 2016. designshack.net/articles/freelancing/how-to-become-a-faster-more-efficient-designer
Merimee, Jordan. “7 Essential Productivity Tips and Hacks for Designers.” Shutterstock. October 24, 2016. www.shutterstock.com/blog/productivity-tips-hacks-designers
Vukovic, Peter. “15 Ways to Design Better and Faster.” 99 Designs. n.d. 99designs.com/blog/tips/15-ways-to-design-better-and-faster
“A Designer’s Time Is Money.” Affordable Printing. February 11, 2014. www.affordableprinting.co.uk/2014/02/11/designers-time-money
“Top 5 Hacks to Brainstorm a Perfect Design with a Tight Deadline.” Fohlio. n.d. learn.fohlio.com/top-5-hacks-to-brainstorm-a-perfect-design-with-a-tight-deadline

Looking Back on the Birth of PowerPoint

It’s hard to imagine life without the comforts of modern technology that people know today: smartphones, 24/7 Internet access, computers that basically provide anything and everything with the push of a few buttons, and the like. Now, you’d think that innovation is an everyday occurrence, but that wasn’t the case in the mid-1900s, especially for businesses.

Back in the early 60s, Roger Appeldorn invented the first overhead projector. It had a simple principle of using light reflected upon mirrors to display data printed on transparencies (a.k.a. foil or viewgraph), paper-sized sheets of cellophane. The bulky instrument became a mainstay in meeting rooms, but the processes to create one sheet of transparency were tedious and time-consuming (inkjet printing was still a new thing). If not printed, then presenters would handwrite data to be projected on the transparencies. That is, until the 90s. What happened?

Microsoft PowerPoint happened.

Its revolutionary and innovative approach to creating presentations gave it an edge over its more than thirty competitors. Its timing with the booms of both the Apple and Windows operating systems—primitive as they were—cemented its growth. And its fundamental function hosted other uses it wasn’t intended for, like classroom operations and simple public speaking exercises (and not-so-simple ones like the TED Talks). Yes, it’s that flexible.

Today, PowerPoint is at its latest version: PowerPoint 2016, as part of the Microsoft bundle Office 2016. More than two decades since the first version was published, PowerPoint is at its prime—with no signs of slowing down anytime soon. Although it has seen its share of competitors, the presentation designer software remains as strong as ever, if not stronger.

So how did this juggernaut of a program come to fruition? How about a teaser? For starters, did you know that PowerPoint didn’t start as an internal project of Microsoft? The following infographic will take you through decades across the technological history to the go-to presentation software that is—and will always be—Microsoft PowerPoint.

Resources:

Akanegbu, Anuli. “Vision of Learning: A History of Classroom Projectors.” EdTech Magazine. February 28, 2013. www.edtechmagazine.com/k12/article/2013/02/vision-learning-history-classroom-projectors

“Life Before the Web – Running a Startup in the 1980’s.” The Zamzar Blog. July 13, 2016. blog.zamzar.com/2016/07/13/life-before-the-web-running-a-startup-in-the-1980s

Infographics: Helping Businesses Attract More Clients

Today is the age of images of any form. Memes, videos, portraits, selfies, etc. There are many statistics that support their effectiveness. Imaged tweets are retweeted 150% more than regular tweets. Facebook posts with pictures are engaged by users more than twice than without. Infographics are shared three times more than other kinds of content.

The last part is very interesting. What is it with an infographic that makes it shared more than videos and memes? Perhaps it’s because of the visual manner that quality information is presented or because of how a really good one looks. There are many examples of great infographics, each different from the other, used for different purposes.

In your case, you’d want it for your business. But why an infographic? There many benefits to using one. Below are some.

Infographics: Cater to the Visual

Caters to the Visual

As is often said, humans are visual creatures. It’s how the human race survived for millennia. Seeing the world and decoding, deciphering, and learning from the information allowed us to be wary of our surroundings and determine whether there was imminent danger or not. Dark? You bet. But it also works on the positive side.

How humans interpret color and design plays a huge part on the overall perception of an object. If it’s aesthetically appealing, then chances are it will be treated better. This is especially true for an infographic. The better its design, the more positive the reaction it will solicit. Pair that off with great content and you’ve got on your hands a powerful medium that can turn situations around.

As with everything in life, there’s a caveat with using either too many or too few elements: they, respectively, can be grounds for over- and underwhelming the viewer. Having too many runs the risk of losing focus on subjects that are supposed to be focused on; having too few—but not being minimalist, per se, or a bad impression thereof—can be seen as just plain at best. You don’t want to create a bad one, don’t you?

Infographics: Good Way to Dump Information

Information Dump … in a Good Way

Look back on the roots of infographics. There’s a reason why it was made into the visual-oriented image it is understood today: it’s a better way of presenting data that would otherwise have been plain, dull, or outright boring.

Imagine graph upon graph, chart upon chart, of cold numbers and percentages, and you can’t make sense of it because you only have a vague idea of what they’re about. Infographics fix this by masking all the data behind creative use of design. How about long texts that are otherwise bothersome to the point of difficult to read? Appropriate and powerful images can do the same for a fraction of the time.

There are many different ways you can replace text with images. And if you can do that exactly with facts and figures, then you’re a step closer to using infographics to your greatest advantage.

Infographics: Shareable Online

Social Media Shareability

This is where the word “viral” comes in. When your infographic is exceptionally great, it will receive more attention than a subpar one. And when it gets more attention—and reaction, as a direct result—people are more likely to share it on social media to spread the good news. Think of it as digital word-of-mouth. The more your piece spreads, the farther your influence and reputation can go. The more people you will reach thus prompting another round of shares. Then you’ll be known in different parts of the world.

Your infographic becoming viral is more than just about creating one of the better ones, though. There’s a meticulous process that follows, but that part is more on you and how you follow through. Don’t let it do all the work. You’re just as responsible for its relevance and maintenance as you are with its shareability.

So, back to your business. How is it affected by those three above? It leads to a wider base of people that get to know your brand. Think of it as a brand reputation manager/expander/propagator. That’s the very least you could gain. But imagine the consequences.

Once you’ve got more people thinking about your brand, you’ve got more choices for leads—and eventually, conversions. All because of a viral infographic. An exaggeration, perhaps, but it’s plausible. And that may be the biggest push you need to work that much harder, that much better. You up for it?


Resources:

Barkins, Kyle. “Infographic: Why Are Infographics So Shareable?” Tech Impact. February 19, 2016. blog.techimpact.org/infographic-infographics-shareable

Cleary, Ian. “How to Make an Infographic that Attracts Massive Attention.” RazorSocial.com. March 16, 2016. www.razorsocial.com/how-to-make-an-infographic

Doyle, Latasha. “Value Content over Creation: Make Your Infographic Useful.” Easely. January 6, 2017. www.easel.ly/blog/make-your-infographic-useful

Knopfler, Hack. “The Top 10 Worst Infographics of All Time.” Mammoth Infographics. July 21, 2015. www.mammothinfographics.com/blog/the-top-10-worst-infographics-of-all-time

Mawhinney, Jesse. “42 Visual Content Marketing Statistics You Should Know in 2017.” HubSpot. January 3, 2017. blog.hubspot.com/marketing/visual-content-marketing-strategy#sm.0001frknxr3k3dlkqq22lsqtd9h7a

McCue, TJ. “Why Infographics Rule.” Forbes. January 8, 2013. www.forbes.com/sites/tjmccue/2013/01/08/what-is-an-infographic-and-ways-to-make-it-go-viral/#4224ed16353c

Mineo, Ginny. “The Anatomy of a Highly Shareable Infographic.” HubSpot. May 12, 2014. blog.hubspot.com/marketing/the-anatomy-of-a-shareable-infographic#sm.0001frknxr3k3dlkqq22lsqtd9h7a

Patel, Neil. “5 Ways to Get Your Infographic to Go Viral.” Quicksprout. June 11, 2012. www.quicksprout.com/2012/06/11/5-ways-to-get-your-infographic-to-go-viral

Popovic, Aleksandra. “Another Way to Use Infographics: E-Courses!” Easely. September 19, 2016. www.easel.ly/blog/another-way-to-use-infographics-e-courses

Looking for creative presentations that can leverage your business? Enjoy free PowerPoint templates from SlideStore! Sign up today.

Pantone’s Color of the Year and How You Can Use It for Business

Pantone calls itself “the world-renowned authority on color,” and perhaps rightfully so. The company has been in business since 1963, when its founder devised the Pantone Matching System, a standard scheme for identifying and communicating different shades and hues.

At the turn of the millennium, the company launched the project, “Color of the Year.” For seventeen years now, Pantone’s color forecasting has been a self-fulfilling prophecy. Different industries worldwide refer back to it when releasing new trends.

The Art of Color Forecasting

Although Pantone’s Color of the Year is widely anticipated and supported by a number of industries, the science behind it is still obscure. As Pantone senior vice president Ron Potesky said, “The complexity of the logic behind Color of the Year is greater than interior design or fashionit’s a forecast, a reflection of what’s happening in the world.”

The process of color forecasting is not a simple one, although it’s highly subjective in nature. For months on end, the Pantone team gathers what they call “proof points” from all over the world. They go to car shows, runways, decorator showcases, and other important events that define culture and lifestyle. They try to make sense of meaningful overlaps so they can distill the mood and state of the times into a single color.

Pantone’s yearly selection serves no direct purpose to the consumer world, but its influence can be observed in many sectors. Owing to its longevity and the power of social media, the project has reinvented itself as an authority in color trend selection.

If you’re into the colors game, check out this infographic about Greenery, Pantone’s 2017 Color of the Year.

Colors and business always go hand in hand. The consumer world is about trust and persuasion, and it’s hard to accomplish either or both if your brand is portrayed in a dull and dismal way. Choose a vibrant and fresh palette this yearone that includes Greenery, perhapsand you might just see your customers showing more interest in your business.

Back up your skills with a well-designed PowerPoint presentation by letting our team to assist and offer you a free quote!

Resources:

Beals, Rachel Koning. “Nature and New Beginnings Inform Pantone’s 2017 Color of the Year: Greenery.” Market Watch. December 8, 2015. www.marketwatch.com

Budds, Diana. “Pantone’s New Color of the Year Is Weird and Perfect.” Facto Design. December 8, 2016. www.factodesign.com

Friedman, Vanessa. “Color of 2017? Pantone Picks a Spring Shade.” New York Times. December 8, 2016. www.nytimes.com

Hazzard, Tracy Leigh. “Why Pantone’s Color of 2017 Matters to Your Business.” Inc. December 9, 2016. www.inc.com

Hua, Karen. “Pantone’s Color of the Year 2017 Is Inspired by Nature and Influences Design.” Forbes. December 9, 2016. www.forbes.com

Pasquarelli, Adrianne. “How Pantone Picks Its Color of the Year.” Advertising Age. December 22, 2015. adage.com

Stewart, Jude. “Pantone’s 2017 Color of the Year: Greenery!” Print Mag. December 8, 2016. www.printmag.com

Stock, Kyle. “How Pantone Is Still Turning Color into Money.” Bloomberg. August 27, 2015. www.bloomberg.com

Weiss, Dyanne. “Does Pantone’s Color of the Year Influence Marketing?” Chron. n.d. smallbusiness.chron.com

“Color Can Influence Emotions in a Way that Few Other Mediums Can.” Digital Skratch. n.d. digitalscratch.com

“Color Psychology: How Does Color Affect Us?” Pantone. n.d. www.pantone.com

“Color Psychology: The Emotional Effects of Colors.” Art Therapy. n.d. www.arttherapyblog.com

“Introducing Greenery.” Pantone. n.d. www.pantone.com

“Shinrin Yoku.” Shinrin Yoku. n.d. www.shinrin-yoku.org

Looking for creative presentations that can leverage your business? Enjoy free PowerPoint templates from SlideStore! Sign up today.

Making Your Presentation Stand Out with Powerful Design

Once you’re onstage, the stars are you and your presentation. Of course, your training got you there in the first place: charisma, clear and loud voice, likable aura—public speaking skills polished over and over again until they’re perfect, almost like second nature, and suited to your needs—and appropriate for every crowd imaginable.

But what about your presentation? Is it tailored to your audience? There’s a risk you don’t want to take when, despite how good you are as a speaker, your presentation is not as appealing: you don’t get your message across as effectively as you want, vis-à-vis death by PowerPoint.

Since humans are visual creatures, our brains process imagistic information faster and more efficiently than text. This is a benchmark you should take advantage of when creating visually appealing and enticing slides, a tip awesome presentation designers always live by. Check this infographic for tips on how to charm your audiences, arrest their attention, and, most importantly, get your message across.

Visuals play an important role when arresting attention. In a world of eight-second attention spans and faster everything—connectivity, accessibility, and even loading times—people would rather spend more of their time on different, more valuable things.

Come to think of it, it’s a cyclical cause and effect: everything is faster, so people expect things to be even faster, ergo the short attention spans. Kind of a messed-up Pygmalion effect, only for things instead of persons.

With that happening, there’s now two steps to do: get their attention and retain it. Good, proper, and creative use of visuals can already do the first, and they can certainly take care of the second, especially when your topic goes from “something that makes them curious” to “something that genuinely piques their interest and makes them ask questions.”

There’s a beauty that certain senses can solely appreciate. Music to the ears. Caress on the skin. For the eyes, it’s appealing design. Beauty. Make something that both you and your audience will appreciate. In turn, they will appreciate you.

Resources:

Golden, Felicia. “The Power of Visual Content: Images vs. Text.” eyeQ. February 11, 2015. www.eyeqinsights.com/power-visual-content-images-vs-text

McSpadden, Kevin. “You Now Have a Shorter Attention Span than a Goldfish.” Time. May 14, 2015. www.time.com/3858309/attention-spans-goldfish

Looking for creative presentations that can leverage your business? Enjoy free PowerPoint templates from SlideStore! Sign up today.

Season of Giving: Making Your Audience Happier with Gifts

Ah, the Yuletide season. Nothing like the cold winter nights, all snuggled up in a blanket and drinking hot chocolate or eggnog—or any hot drink at all. Perhaps alone, if you so choose, or with loved ones. A cozy thought, especially for those looking to make the most out of this time of the year.

And by “make the most out of this time of the year,” let’s define it as “going out and spreading the message of the holidays.” Or, you know, “the season of giving.” This group of PowerPoint presentation professionals would like to think that, aside from the above statement, we consider that every day should be like Christmas—and in turn, every presentation should be just as giving as the last, if not more.

But what are you actually giving to your audience? Do you have to be a secret Santa to do that? Let’s take a step back and have a look from the observer’s perspective with this gifographic.

Making Your Audience Happier with Gifts

There’s no season like Christmas. For many, it’s a time of cheer and splendor, while for some, it’s a time of charity and selflessness.

For each and every one, it’s about merrymaking. Parties with officemates, friends, family, and relatives all make the holidays worthwhile. Get-togethers from distant beloveds and reunions with people you seldom see but often miss. Getting into the spirit of the season with decorations, fetes, and gift-giving truly make it a joyous part of the ending year.

And there’s no feeling better in the world than the merriment spent with those close to you.

It’s not as if your audience shouldn’t be treated as such. They’re an integral part of your task—as small as a group of company executives or as big as a jam-packed auditorium as it may be. Your audience is one of the reasons you’re onstage; they’re there to cheer you and to make sure you’re not doing this in vain.

Don’t take for granted that kind of support. You and your audience are playing your parts. Make the best out of it.

Resources:

Dorfman, Jeffrey. “Twenty Quotes And Verses On Giving For Christmas.” Forbes. December 25, 2014. www.forbes.com/sites/jeffreydorfman/2014/12/25/20-quotes-and-verses-on-giving-for-christmas/#54867dde1e17

Mack, Lloyd. “Christmas is the season for giving.” Kenora Daily Miner & News. December 1, 2016. www.kenoradailyminerandnews.com/2016/12/01/christmas-is-the-season-for-giving

Looking for creative presentations that can leverage your business? Enjoy free PowerPoint templates from SlideStore! Sign up today.

-->