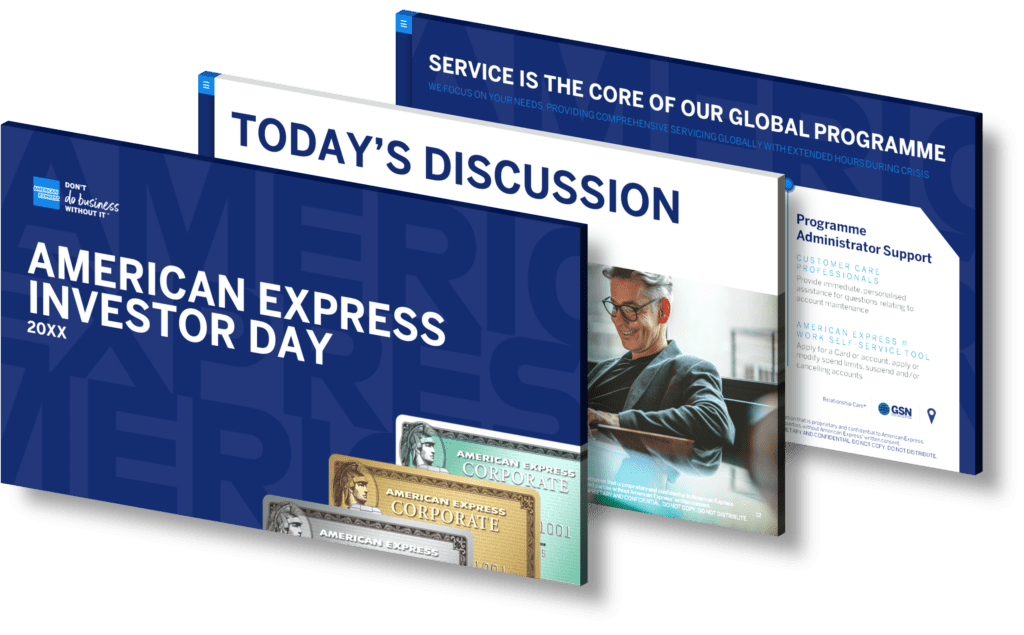
Businesses can leverage infographics as a powerful tool to effectively present financial growth at conferences by combining compelling visuals with concise data presentation. Infographics allow complex financial information to be simplified, making it easier for audiences to grasp key metrics and trends at a glance. By using charts, graphs, and icons, businesses can illustrate their financial performance over time, highlight significant achievements, and showcase projections for future growth. Additionally, incorporating brand colors and logos into the design enhances brand recognition while maintaining professional aesthetics.
When creating an infographic for a conference presentation, it’s essential to focus on clarity and relevance. Start by identifying the most impactful data points you wish to communicate—such as revenue increases or market share expansions—and arrange them logically within the infographic. Utilize storytelling techniques by guiding your audience through the narrative of your company’s financial journey; this approach not only captivates but also fosters better retention of information among attendees.
Moreover, consider integrating interactive elements if possible; digital infographics that allow real-time engagement can significantly enhance audience involvement during presentations. This interaction may include clickable charts or live data updates that facilitate deeper discussions about financial strategies.
In summary, using infographics in conference settings empowers businesses to present their financial growth effectively through visual storytelling that is easy to understand and memorable for the audience.
View Our Presentation Portfolio


