7 Apps Every Presenter Should Use

Business Overview Presentation

Custom Designed Presentations

data

liberated intelligence

PowerPoint Agency

PowerPoint Design

PowerPoint design experts

PowerPoint Experts

PowerPoint specialist

Powerpoint tips

Presentation Agency

Presentation Company

Presentation Consultation

Presentation Designers

Presentation Firm

Rick Enrico

SlideGenius

VGA

Whiteboard Transform


“With all the apps out there, it’s easy to get stuck with the same icons on your home screen — and never so much as click on the newer ones that would benefit your business most.” – Mashable

Each of these apps have the capability to make your presentations more effective, organize your time to complete those PowerPoint presentations more efficiently, or just make your life easier in general.

1. Lift

Lift helps you achieve your goals, big or small. With your busy schedule, traveling, and running from conference to conference, it is important to stay organized, and keep the important goals you have in check. Lift will force you to keep consistently working on your important goals or tasks at whatever frequency you want.

2. CloudMagic

CloudMagic is a universal and indispensable search engine for all your data. CloudMagic lets you search across Gmail, Yahoo, Dropbox, Evernote, etc., through one simple search box. Very useful when putting together data for any investor pitch, corporate presentation, or sales pitch!

3. TripIt

Tripit is most useful for our “always traveling” presenters. TripIt gives you the ability to organize your travels just by forwarding your booking confirmations to an email address. This app will reduce your stress five times over and will allow you to relax and focus on your presentation instead of the flight.

4. Refresh

Refresh digs through social networks to provide users with a bio on anyone before meeting them; a great way to get some research on your audience prior to delivering your PowerPoint! Knowing the dirty “deets” on specific audiences will allow you to relate to them, which will in turn keep them interested.

5. Audible

As a speaker, you should always be learning and reading books. It’s a great way to keep a steady stream of personal stories, quotes, or news that will come in handy to keep your data unique, interesting, and relevant. I’ve found Audible extremely helpful to listen to books while on the go.

6. LIA

With LIA you can access sales content in the field on a tablet and it works. When you only have 5 minutes with your prospect – trust LIA

7. Corkulous

Corkulous is an easy-to-use idea board only for iPads in which you can collect, organize, and share your ideas in a completely natural and organic way.

8. Sadun’s Whiteboard

This app lets you transform your IPad into a presentation screen and connect to any projection system using an Apple VGA connection or composite/component video-out cable and draw directly to an external screen using standard whiteboard markers and erasers. Really creative way to do live examples of anything you’re presenting on.

If you know any other useful apps for presenters or work related to presentations, feel free to comment them below to be added to this post!

References:

Gerber, Scott. “15 Underrated Apps Every Entrepreneur Should Use.” Mashable. October 26, 2013.

Tan, Kay. “30 Useful IPad Apps for Business & Presentation.Hongkiatcom.

4 Types of Audience Members You Need to Present For

audience

Custom Designed Presentations

data

how to

metaphors

PowerPoint Agency

PowerPoint Design

PowerPoint design experts

PowerPoint specialist

presentation

Presentation Agency

Presentation Company

Presentation Consultation

Presentation Designers

Presentation Firm

Your audience is filled with 4 different member types of thinkers: analytical, structural, social, and conceptual.

It’s your job to make your presentations appeal to all four. Like any other accomplishment, appealing to all four thinkers will involve research, namely research about how each thinker thinks. We, at our Presentation Agency, have looked into inc.com’s recent series of articles on leadership and compiled a rudimentary set of instructions to appeal to each thinker by analyzing the essentials that make up the foundation of each form of thought.

Analytical

Here’s how you can be sure to draw out your analytical-thinking audience:

  • Show your research.
  • Highlight important data from within the research.
  • You need to show the big picture, not just the details.
  • Provide a case study.
  • Analyze past successes to allow your team to develop new ideas.
  • Provide an overview as well as objectives.
  • Clarity about your needs is critical.
  • Quantify everything
  • Use analytical phrases like:
      • What is the cost/benefit of this project?
      • What does the research say?
      • I’ve been analyzing the situation.

Structural

So here’s how to communicate in aims to draw out your structural-thinking audience:

1. First, it’s important to understand that a structured thinker learns by doing

2. Next, provide plenty of “how-to” points

3. Hand out a step-by-step implementation plan and a guide for how things need to be done.

4. Explain through practicality.

5. Communicate in concrete terms and explain the rules.

6. Be very detailed.

Social

  • Here’s how you can be sure to draw out your socially oriented audience:
  • Don’t be afraid to refer to feelings.
  • Use questions like:
      • “How does that appeal to you?”
      • “How are you feeling about this?”
  • Or statements like:
      • “I’m concerned about how others will react.”
  • Show a personal connection.
  • Phrases that evoke this:
      • “Let’s work through this together.”
      • “Is everyone on the same page?”

Conceptual

Here’s how you can be sure you speak and interact conceptually to draw out your conceptual-thinking audience:

  • Think long-term; Where do we want to be in 5 years? You can always fill in the details and short-term afterward
  • Describe the levels or stages of your plans or ideas
  • Use abstract examples or metaphors
  • Define key terms

Thinking through this form of audience analysis will allow you to maximize the research for PowerPoint presentation, which will in turn lead more sales!

References:

Browning, Geil. “Why Being Social Makes You a Better Leader.” inc.com. July 15, 2013.
Browning, Geil. “Why Steve Jobs’ Exactitude Mattered as Much as His Vision.” inc.com. May 16, 2013.

Raising Capital? Consider a Scrolling Web Pitch!

audience

Custom Designed Presentations

data

investor presentation

pitch deck

PowerPoint Agency

PowerPoint Design

PowerPoint design experts

PowerPoint specialist

presentation

Presentation Agency

Presentation Company

Presentation Consultation

Presentation Designers

Presentation Firm

presenting

scrolling pitch deck

start up pitch deck

Raising capital is complicated. There are a lot of pieces to put together, including selling your audience, knowing your valuation, how much capital you need, use of funds and much, much more.

The initial hurdle for countless companies comes at the intersection where entrepreneurs and investors meet. Entrepreneurs often stumble building their investment deck and effectively pitching which makes it that much harder to get people to give you the capital. Investors must believe in you and your abilities to manage and grow a company. The problem is that showing who you are and what you’re capable of can be difficult let alone doing it in a 10-15 minute window.

For that reason you need to put your heart and soul into the pitch, but not just the content, also the delivery. What does a perfect pitch look like, you ask? That is a matter of opinion and you’ll never see the “perfect pitch deck”, but recently its all about presenting your company in a unique way to stand out from the crowd.  One additional option you may consider is a scrolling web pitch. Scrolling web pitches incorporate a unique technique that allows the presenter to replace the generic professional PowerPoint click-by-click slides with an interactive, more organic and lively design.  This is not meant to replace the face-to-face PowerPoint pitch but a reinforcement and/or teaser to get the meeting.  Here are 4 reasons why you need to use scrolling web designs for you next investor presentation:

Keep Content Up to Date

In using a scrolling web pitch, you are making any future edits or updates to your text as easy as can be. This design simplifies the process and maximizes your use of time.

Stand Out from the Crowd and be unique

Most people email their large, boring and lifeless PowerPoint presentations to prospective investors, but it really doesn’t make sense to do that. Without context from the entrepreneur you’ll risk a misinterpreted message or worse they might not even move past the first three slides.  Treat you pitch with respect. Why be dull and lifeless when you can be unique, creative and memorable?

Monitor page analytics/views and keep consistency.

Data, data, data! Being able to keep your pitch up to date online and get analytics will help you assess the effectiveness of your deck. Additionally, you’ll have created another venue to market in. A great scroll web pitch will be able to sell itself without you being there, so any viewer could potentially bite in your concept.

Create more interest and leads

Analytics and views lead to increased interest and leads. Garnering and extrapolating public interest in your concept will serve as evidence to potential investors that it is quality and a great opportunity.

Think of it as PowerPoint presentation Darwinism: evolve your presentation or have it die. Though raising capital may be intimidating, challenging, and seemingly impossible, the process starts with how you present yourself to people.

We’ve created an example of a scroll web pitch that you can see here.

If you have any questions or comments about scroll pitches just comment them on this post?

Halloween’s Takeaway Lessons for Presentations and Marketing

Bloomberg Rankings

Custom Designed Presentations

data

Ginger Bread Man

Halloween

Huffington Post

planning

Powerpoint

PowerPoint Agency

PowerPoint Design

PowerPoint design experts

PowerPoint specialist

PPC

Presentation Agency

Presentation Company

Presentation Consultation

Presentation Designers

Presentation Firm

Presentations

Roller Coaster Riders

Work Cited


I say Halloween, what do you think of? Costumes, candy and cavities? Most people do.

The fact of the matter is Halloween is one of the most commercially influential holidays throughout the year. It is crucial to be able to see it as more than just a holiday for young kids to trick-or-treat. In just analyzing 2013’s Halloween’s sales and marketing activity, you’ll be able to tailor the way you present and/or market your company to increase sales for the season, and respectively apply the same tactics to any other holiday in the near future.

Here are a few facts and stats about this year’s Halloween:

1. This year, according to Bloomberg Rankings, it seems Americans are spending less Halloween costumes, candy and decorations

2. Almost 75% of Americans who celebrate Halloween said that the state of the U.S. economy had no impact on their Halloween plans

3. Nearly 33% of “Halloween celebrators” found inspiration for their costumes online

4. About 50% of adults in the western U.S. planning to wear costumes this year, which was the most out of any other part in the country

5. Despite the above fact, the overall number of people above the age of 18 who celebrated Halloween dropped from 71% percent to 65%

6. Americans spent an average of $20.99 per person on Halloween decorations

So what’s the takeaway?

Don’t be most people, do your research with plenty of time before the season hits. Use the information, and market accordingly. Marketing for this may include giving a PPC marketing, online campaigns, or maybe even a professional PowerPoint presentation to pitch. For that reason, it is crucial to prepare yourself for any avenue of marketing by having the necessary data about your potential customers.

 Whether you business runs on sale for adults, teens or children, laying out the bullet points, like we did here, will help you understand how your market reacts to any event and will consequently let you prepare your corporate presentations or pitches with a more complete and well-rounded background. 

 I’ll leave with Huffington Post’s hilarious list of 2013’s best costumes: http://www.huffingtonpost.com/2013/10/29/best-halloween-costumes-o_n_4170143.html


Reference:

Murray, Brent. “The Scary Truth About Halloween: Oh, My!Bloomberg.com. October 31, 2013.

Captus is Ready to Crush Their Competition

Custom Designed Presentations

data

LSR

planning

Powerpoint

PowerPoint Agency

PowerPoint Design

PowerPoint design experts

PowerPoint specialist

presentation

Presentation Agency

Presentation Company

Presentation Consultation

Presentation Designers

Presentation Firm

Though Captus

Captus provides proven military-grade analytics to big data in the commercial sector.


 The company is an essential component in the field of analytics. Anyone could see that both their product and service were both top-of-the-line. Even then, Captus knew what most seem to overlook, which is that it doesn’t matter how good your product or service is, if you cant convince anyone to buy it, its practically useless. 

For that very reason they knew they not only deserved, but required top-of-the-line branding. Investing in the way you look as a company is one of the most crucial elements for sales.Their professional PowerPoint presentation, designed by SlideGenius, effectively showed Captus’s product, process and key capabilities, which in turn made it very easy for their audiences to understand their holistic concept and solution.By developing a very high-quality professional PowerPoint presentation, Captus was able to display the issue their worked was based off of in a useful way.

The issue they worked on was that acquiring detailed information from multiple databases takes a huge amount of effort and time.

The presentation thoroughly emphasized the benefits of choosing Captus over their competition by focusing on the core differences Captus offers.

 Though Captus already had a self-made PowerPoint presentation, they knew that in order to set themselves apart from their competition they need to be be better, not just in their product or service, but in the way they are seen by others. Being different and being better is what led them to invest in, and now officially have, a chic, insightful, and effective tool for branding and pitching themselves.

“Employing proven defense and space technology, Captus brings real intelligence capabilities to serious businesses by providing complete data management and analysis solutions, not just pretty visualizations.” Now, both their product and their brand are not only unique in their own industry, but effectively maximized.  

To find out how you can start developing your brand and presentation more effectively sign up for a 15-minute discovery call with Slidegenius!

How to Think Like $5.99 and Not Like $6.00

audience

Custom Designed Presentations

data

Focus

Hans Rosling

Jonah Berger

PowerPoint Agency

PowerPoint Design

PowerPoint design experts

PowerPoint specialist

Presentation Agency

Presentation Company

Presentation Consultation

Presentation Designers

Presentation Firm

presenting

TED

Imagine you own a clothing store. Now you decide to begin a sale for that store. Let’s say a particular type of shorts usually costs $20 per short, but for the purposes of the sale you’re going to mark them down to $15 a piece.

There are two ways you could present that discount. The first would be as a percentage. Going from $20 to $15 would be 25% off. The second would be as an absolute number with $5 off. Which way is better?

Both discounts amount to the same final price. 25% off $20 and $5 off $20 both result in the customer paying $15 for the shorts. So both representations of the discount should have the same effect, right?

Wrong. Jonah Berger, author of Contagion, explains to us that the consumers find the 25% discount more attractive than the 5$ off. While the two discounts are the same economically, they don’t trigger the same psychological effect. One feels like a larger discount than the other.

Accordingly, the next time you’re reporting numerical information, pay attention to how you are presenting it. The way changes are represented can have a big impact on how they’re perceived.

Focus on the final number.

Like the story above, most people seemed to be more enticed by the offer when the discount number was larger. Rule of thumb would be whenever you are offering a discount under $100 display it as a percentage, and when the offer is greater than $100 display it as an absolute number. This will make sure you are always maximizing your psychological impact. Simpler is better. No one cares about a page of numbers and figures that look like the green screen display from the matrix. You need to simplify your results, and then simplify them again. Think of your raw data as a pile of freshly picked vegetables. People don’t want to eat them when they still have dirt and leave stems on them. People want a quick and painless way to stay healthy, so what do you do? You take those vegetables, clean them, cut them, put them in a blender and make a smoothie. Then you take that smoothie and turn it into a wheatgrass shot. Quick and to the point. So yes, your data should be reduced to the size of a wheatgrass shot! After all, the simpler your can represent your findings, the easier it will be for your audience to understand you, which will in turn make your call-to-action more successful.

Tell a story.

Everyone knows the best stories are the ones told with pictures, so use them. Portraying data graphically reveals patterns in the data that are hard to notice otherwise Visual depictions of data are almost universally understood without requiring knowledge of a language. It is also useful to alter your tone and speed as you approach the finding of any given graph. Much like when telling a story, the storyteller tends to get really excited toward the climax or “best part” of the story; it is not only useful but critical to draw attention to the most important features of the data.

I’ll leave you with Hans Rosling’s fascinating TED talk revolved around displaying data effectively, which you can watch here.

References:

Berger, Jonah. “Fuzzy Math: What Makes Something Seem Like A Good Deal?linkedin. August 28, 2013.

Kakutani, Michiko. “Mapping Out the Path to Viral Fame.” The New York Times. February 25, 2013.

Rosling, Hans. “The Best Stats You’ve Ever Seen.ted.com. February 2006.

Aflac Uses SlideGenius to Present a New Data-Heavy Sales Strategy to Its Team

Aflac

Custom Designed Presentations

data

PowerPoint Agency

PowerPoint Design

PowerPoint design experts

PowerPoint specialist

presentation

Presentation Agency

Presentation Company

Presentation Consultation

Presentation Designers

Presentation Firm

statistics

United States

Aflac, a leading provider of supplemental insurance in the United States, is known for its innovation and forward-thinking approach to business. To keep up with evolving market trends, Aflac recently revamped its sales strategy, focusing heavily on data-driven insights to enhance performance and efficiency. With a complex strategy packed with data, metrics, and new initiatives, Aflac needed a presentation that would not only communicate this information clearly but also engage their sales team effectively. For this crucial task, they turned to SlideGenius, a trusted expert in presentation design.

The Challenge: Making Complex Data Digestible

Sales strategies are often packed with numbers, charts, and analysis, and Aflac’s new approach was no exception. The challenge for Aflac was clear: how do you take a data-heavy strategy and present it in a way that is both engaging and easy to understand for a diverse sales team?

The presentation had to strike a balance between delivering detailed insights and keeping the audience’s attention. They needed to ensure that key metrics, trends, and strategic initiatives were communicated effectively without overwhelming the team. The solution? A highly visual, well-organized, and interactive presentation that simplified complex data while keeping it impactful and engaging.

Why SlideGenius?

With a reputation for crafting compelling presentations, SlideGenius was the natural choice for Aflac. As a leader in custom PowerPoint presentation design, SlideGenius has helped numerous companies across industries translate their data, insights, and strategies into clear and visually engaging slides. Aflac knew that SlideGenius had the expertise to create a presentation that could transform raw data into a narrative that resonated with their sales force.

The SlideGenius Approach: Data Simplified Through Design

To help Aflac present its new data-heavy sales strategy, SlideGenius focused on three core elements: visual storytelling, data visualization, and engagement.

1. Visual Storytelling

Aflac’s new sales strategy needed to be more than just a collection of charts and numbers—it had to tell a story. SlideGenius crafted a cohesive narrative that walked the sales team through the data step by step. Each slide was carefully designed to build on the previous one, guiding the audience through key insights and actionable takeaways.

Instead of simply showing numbers, SlideGenius used impactful visuals and graphics to explain the “why” behind the data. This storytelling approach ensured that the sales team not only understood the strategy but also connected with it on a deeper level, seeing how each data point contributed to their overall success.

2. Data Visualization

The heart of Aflac’s sales strategy was data—sales trends, customer demographics, performance metrics, and market insights. Translating this data into an easily digestible format was critical. SlideGenius employed advanced data visualization techniques, such as dynamic charts, infographics, and interactive graphs, to turn raw data into clear, understandable visuals.

Each visualization was tailored to match Aflac’s brand identity, making the presentation not only informative but visually consistent with the company’s image. By focusing on clean and modern design, SlideGenius ensured that the data wasn’t overwhelming but rather complemented the narrative of the strategy.

3. Engagement Through Interactive Elements

To keep the sales team engaged, SlideGenius incorporated interactive elements throughout the presentation. Clickable data points allowed team members to dive deeper into specific metrics or areas of interest without interrupting the flow of the presentation. Interactive timelines and diagrams provided a hands-on way to explore the new sales initiatives in detail.

These interactive elements empowered the sales team to explore the strategy at their own pace, ensuring that each member fully grasped the material before moving forward. This level of engagement is critical in retaining attention during data-heavy presentations.

The Results: A Winning Presentation

Thanks to SlideGenius, Aflac’s sales team was able to fully grasp the new data-heavy sales strategy without feeling overwhelmed by the complexity of the information. The feedback was overwhelmingly positive: the clear visuals, organized flow, and interactive elements kept the team engaged and allowed them to absorb the material effectively.

By breaking down complex data into digestible segments and presenting it in a visually compelling way, SlideGenius helped Aflac ensure that every member of the sales team left the presentation with a clear understanding of the strategy—and the confidence to implement it successfully.

Why Aflac and Other Companies Choose SlideGenius

Aflac’s success story with SlideGenius highlights the importance of expert presentation design when it comes to communicating complex information. Here’s why Aflac and other leading companies trust SlideGenius:

  • Expertise in Data-Heavy Presentations: SlideGenius specializes in transforming dense, data-heavy content into visually engaging presentations that are easy to understand.
  • Tailored Solutions: Each presentation is customized to meet the specific needs of the company and audience, ensuring that the message is communicated effectively.
  • Visual Appeal and Branding: SlideGenius ensures that every presentation aligns with the company’s brand identity, creating a polished and professional look that resonates with audiences.
  • Engagement Focus: With a focus on interactive and dynamic elements, SlideGenius designs presentations that keep audiences engaged from start to finish.

Final Thoughts

For Aflac, presenting their new sales strategy was more than just an information dump—it was about rallying their sales team around a shared vision. SlideGenius’ expertise in presentation design helped them deliver a complex, data-heavy strategy in a way that was clear, engaging, and actionable.

If your business is looking to elevate its presentations—whether for internal teams, clients, or investors—SlideGenius offers the perfect blend of design, strategy, and storytelling to ensure your message hits home. For more information on custom presentation design, visit SlideGenius or explore ready-made templates at SlideStore.

The Need for Data Visualization in Presentations

Custom Designed Presentations

data

Data Visualization

PowerPoint Agency

PowerPoint Design

PowerPoint design experts

PowerPoint specialist

presentation

Presentation Agency

Presentation Company

Presentation Consultation

Presentation Designers

Presentation Firm

professional presentation

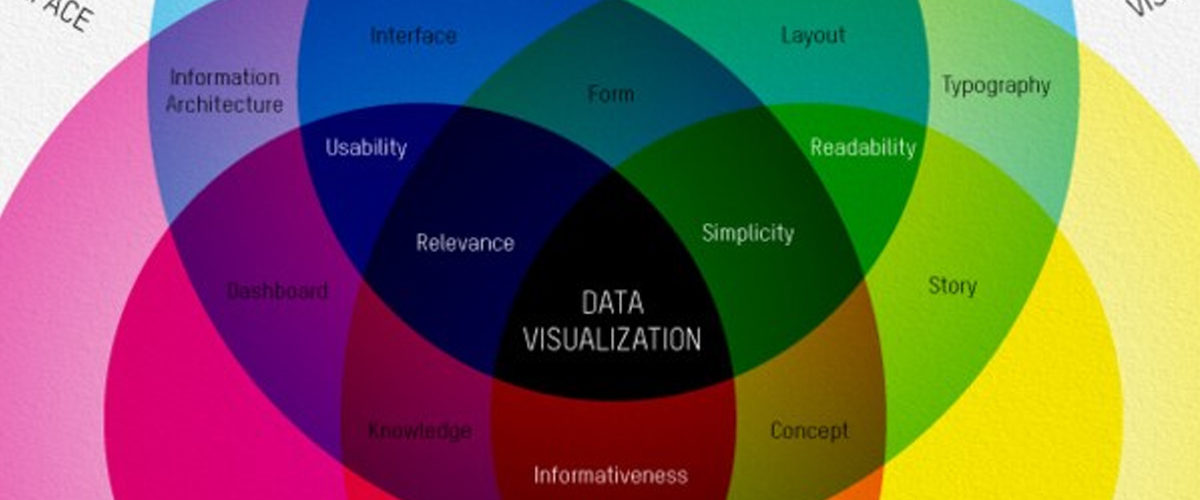
In today’s information-driven world, data plays a crucial role in decision-making. However, raw data alone can overwhelm or confuse an audience, especially during presentations. Data visualization is the solution. It transforms complex data sets into visual formats that are easier to understand, interpret, and act upon. Charts, graphs, infographics, and maps make large amounts of information digestible, enabling you to convey key insights quickly and effectively.

Here’s why data visualization is essential in presentations:


1. Simplifies Complex Information

Raw data can be intimidating, especially in large quantities. Data visualization helps simplify complex information, allowing the audience to grasp key points without having to sift through numbers.

Why It’s Important:

  • Improves Understanding: Visual representations of data are easier to interpret, making complex information more accessible.
  • Clarifies Patterns: Charts and graphs can reveal trends, correlations, and outliers that might be missed in raw data.

Example: Instead of showing a spreadsheet filled with sales data, a line graph can illustrate the upward trend in sales over the last year, making it easier for your audience to spot patterns.


2. Engages Your Audience

Presenting data in a visual format helps break up text-heavy slides and keeps your audience engaged. Visuals are more stimulating than rows of numbers and can capture attention more effectively.

Why It’s Important:

  • Enhances Engagement: Visuals are processed faster by the brain than text, keeping your audience more focused and attentive.
  • Increases Retention: People are more likely to remember information presented visually than through text or spoken word alone.

Example: Using a pie chart to show market share distribution among competitors grabs attention more effectively than listing percentages in bullet points.


3. Highlights Key Insights

Data visualization helps presenters emphasize the most important data points and insights. By visually highlighting trends or critical metrics, you can guide your audience’s attention to the key takeaways.

Why It’s Important:

  • Focuses Attention: Visuals direct the audience to the most significant data points without requiring them to sift through irrelevant information.
  • Increases Persuasiveness: Well-designed visuals can strengthen your argument by making data more compelling and easier to understand.

Example: A bar chart comparing the revenue growth of two products can make it obvious which product is performing better, allowing the audience to quickly grasp the comparison.


4. Makes Data More Persuasive

Numbers can be powerful, but they are even more impactful when presented visually. Data visualization allows you to build a more convincing narrative by backing up your points with clear, compelling data.

Why It’s Important:

  • Builds Credibility: Visualizing data makes your information look more professional and trustworthy.
  • Increases Persuasion: Seeing data in a chart or graph format can make your argument more convincing to the audience.

Example: Showing a decline in customer complaints via a line graph over time reinforces the success of a customer service initiative.


5. Saves Time

Data visualization allows you to communicate more information in less time. Instead of explaining data point by point, a chart or graph can instantly convey key trends or comparisons, making your presentation more efficient.

Why It’s Important:

  • Increases Efficiency: Visuals convey a lot of information at a glance, saving time for both you and your audience.
  • Improves Focus: You can present the core insights without overwhelming your audience with data overload.

Example: A heatmap showing regional sales performance allows the audience to instantly see which areas are underperforming without the need for lengthy explanations.


Final Thoughts

Data visualization is essential for making your presentation clear, engaging, and persuasive. It simplifies complex information, grabs attention, highlights key insights, and saves time for both presenters and audiences. Whether you’re presenting financial reports, marketing metrics, or operational data, using visual aids like graphs and charts will help you deliver your message effectively.


The Do’s and Don’ts of Slide Design

Slide design plays a critical role in the success of any presentation. Well-designed slides enhance your message, making your content more engaging and easier to understand. However, poor slide design can confuse or distract your audience, taking away from the effectiveness of your presentation. To ensure that your slides are helping, not hindering, your message, it’s important to follow a few key design principles.

Presentation Lessons from the Fed; Intentional Vagueness & Ambiguity

Alan Greenspan

Although Fedspeak

audience

Custom Designed Presentations

data

Europe

Federal Reserve

PowerPoint Agency

PowerPoint Design

PowerPoint design experts

PowerPoint specialist

presentation

Presentation Agency

Presentation Company

Presentation Consultation

presentation design

Presentation Designers

Presentation Firm

statistics

Steve Jobs

When Federal Reserve officials speak, their words are often deliberately vague and ambiguous. This strategy allows them to navigate complex topics without making overly specific promises, giving them flexibility in the future. While this communication style might seem counterintuitive for a presentation, there are times when a similar approach can be useful.

Here are key presentation lessons from the Federal Reserve’s use of intentional vagueness and ambiguity:


1. Manage Expectations Carefully

The Federal Reserve often leaves its statements open to interpretation, which allows for flexibility and adaptability. In presentations, you can use vagueness strategically to avoid overpromising or committing to details that may change.

Why It’s Important:

  • Provides Flexibility: Leaving certain points open-ended gives you the room to adapt as circumstances evolve.
  • Manages Audience Expectations: Ambiguity can help temper audience expectations if the situation is uncertain.

How to Apply It:

  • Use qualifiers such as “likely,” “potentially,” or “subject to change” when discussing future plans or outcomes that may not be guaranteed.

Example: If discussing the projected growth of a project, say, “We are likely to see growth in the next quarter, but it will depend on market conditions.”


2. Avoid Overloading with Specifics

The Fed often refrains from giving overly specific details to avoid overwhelming its audience. Similarly, in presentations, too much granular detail can bog down your message and distract from the key takeaways.

Why It’s Important:

  • Prevents Information Overload: Keeping things high-level allows your audience to focus on the bigger picture.
  • Encourages Audience Reflection: Leaving some details vague encourages the audience to think more deeply and engage in discussion.

How to Apply It:

  • Focus on the broad strokes and only provide specific details when they’re critical to understanding the overall message.

Example: In a presentation about a long-term plan, emphasize the overarching strategy rather than diving into every individual task.


3. Encourage Follow-Up Discussions

The Federal Reserve’s vagueness often leads to analysis and interpretation from experts and stakeholders. You can use this technique in presentations to encourage further discussion and engagement after the formal talk is over.

Why It’s Important:

  • Keeps the Conversation Going: Leaving some aspects of your presentation open-ended can spark curiosity and lead to more in-depth discussions afterward.
  • Builds Engagement: Encouraging follow-up questions or discussions shows that you value input from your audience.

How to Apply It:

  • End your presentation with an open-ended question or a statement that invites feedback: “There are many factors at play, and I’d love to discuss your thoughts on how we can address these challenges moving forward.”

Example: After presenting an industry trend analysis, say, “These are just preliminary thoughts, and the situation is still evolving. I’d welcome further insights as we monitor these changes.”


Final Thoughts

Intentional vagueness and ambiguity, when used strategically, can help manage expectations, simplify complex topics, and foster continued engagement. While it’s important to be clear on key points, leaving room for interpretation can create flexibility and encourage deeper discussions, much like the communication style of the Federal Reserve.

Using Statistics and Metaphors Effectively in Your PowerPoints

audience

Custom Designed Presentations

data

IQ

metaphors

PowerPoint Agency

PowerPoint Design

PowerPoint design experts

PowerPoint specialist

Presentation Agency

Presentation Company

Presentation Consultation

Presentation Designers

Presentation Firm

presentation techniques

presenting

statistics

visuals

Did you know that every person recorded in history that has been able to lick their elbow has had an IQ characterized as that of a genius?  While the previous statement is a complete fabrication of my imagination, it doesn’t negate the fact that you just thought of licking your elbow to see if you were a genius.

Statistics, metaphors, pictures, videos they all make us think in very specific and useful ways. Knowing how to manage these presentational aids can be what makes your next presentation sound like if you have been taking private classes with Tony Robins.

Presentations bogged down by statistics, overwhelming data, and technical topics can send your audience dozing off in minutes, but never fear, there are a few techniques that can help you convey the true significance of what you’re presenting.

When it comes to data, simplify and get creative.

If you’re presenting your data with a table, you might as well be force feeding sleeping pills to your audience. Instead of cramming all your data on to one page, give each statistic its own page, accompany each with a visual, and present them as individual, easy-to-digest morsels. If you have a slide crammed full with numbers, chances are nobody is going to take anything away from it.

Why should we care?

Statistics can captivate when presented effectively, they just need to be framed in such a way that makes your audience understand their significance. Paint a picture that depicts their relevancy. An excellent example of this was done during the 2012 presidential race when there was much to-do over the net worth of President Obama and of Governor Romney.

Adjusting for inflation, George Washington was the United States' richest president of all time.Obama

While it was revealed that Obama was among the poorest presidents ever elected and Romney was among the most wealthy, their combined wealth didn’t even come close to that of George Washington’s, when adjusting for inflation. Framing statistics in this way helps to give life to numbers that can often be monotonous and sedating, because practical application and historical context can make them much more relatable.

Metaphors, metaphors, metaphors.

If you’ve got a tough sell or a hard point to make, a metaphor can often help paint a picture for your audience to wrap their heads around. Metaphors can evoke an emotional response, which is very desirable when presenting potentially dry information, such as an investment opportunity.

Even better, Visual metaphors

When we listen to something, only 3 percent of our brain neurons are engaged, but when we see an image, that number jumps up to 30 percent. As far as engaging an audience on a chemical level, and ensuring that they retain the information you wish to convey, a visual representation of the conclusion your presentation seeks to reach will be, literally, 10 times more effective.

What you talk about is meaningless unless you know how to express it. It all comes down to two factors: how you say it and how you show it. Whether the topic is stem cell research or peanut butter protein bars, the audience will only care based off of how you present what you are presenting.

Harness the power of these presentational aids, and you will rule the world. Not really, but you will definitely have captivated your audience.

SOURCES:

http://www.slideshare.net/CarlKwan/how-to-present-data-and-statistics-visually

http://www.forbes.com/2010/07/14/george-washington-hoover-jfk-obama-personal-finance-10-richest-presidents_slide_5.html

http://soappresentations.com/the-value-of-metaphor-in-business-presentations/