Equinor has once again demonstrated its resilience and strategic prowess in the second quarter of 2024, showcasing exceptional financial and operational performance. This analysis explores how Equinor’s presentation design, structure, visuals, and messaging effectively communicated its success story and future aspirations.
Strategic Presentation Design and Structure
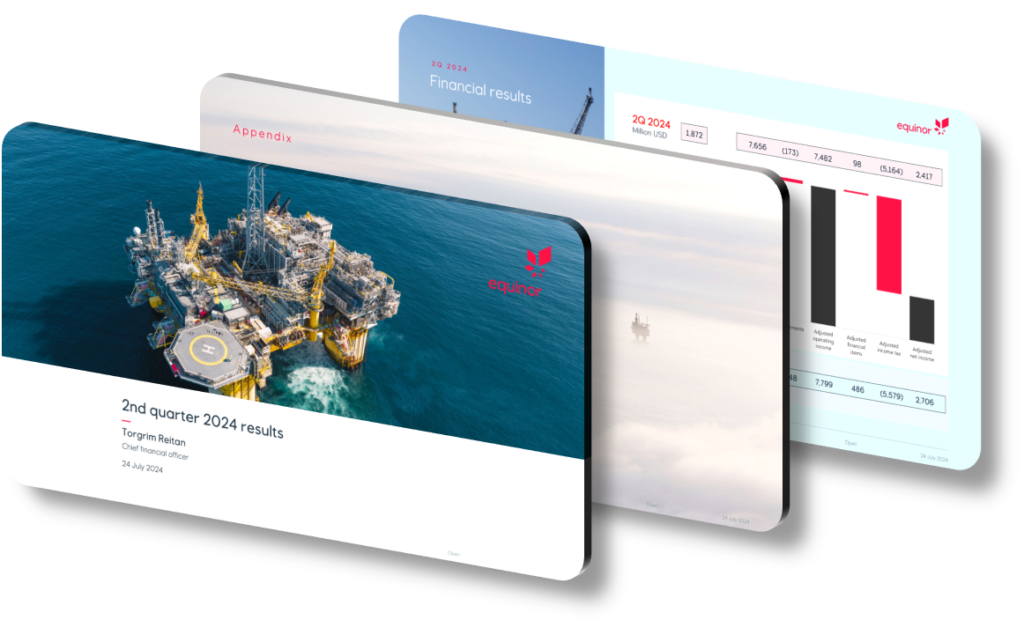
The presentation was meticulously structured to guide the audience through Equinor’s achievements and future plans. It began with an overview of key financial metrics, seamlessly transitioning into strategic advancements and operational highlights. This logical flow ensured that the audience could easily follow and comprehend the comprehensive data.
Compelling Visuals and Clear Messaging

Equinor leveraged compelling visual aids such as charts and infographics to illustrate financial results and operational metrics. These visuals were not only eye-catching but also simplified complex data, making it accessible to a broader audience. The use of color-coded graphs allowed for quick identification of trends and key performance indicators.
Core Content Highlights
- Robust Financial Performance: Despite cash flow impacts from tax payments and capital distributions, Equinor reported solid financial results driven by strong production from key fields like Troll and Oseberg on the Norwegian Continental Shelf (NCS).
- Strategic Advancements: The introduction of new fields online, high-grading their oil and gas portfolio, and securing Carbon Capture and Storage (CCS) licenses in Norway and Denmark showcased Equinor’s forward-thinking approach.
- Renewable Energy Surge: A notable increase in renewable energy production was reported, primarily from onshore power plants in Brazil and Poland, aligning with Equinor’s sustainability goals.
Commitment to Shareholder Returns and Safety
Equinor’s commitment to maximizing shareholder value was emphasized through significant capital distribution via dividends and share buy-backs. Moreover, the improvement in safety metrics, including the Serious Incident Frequency (SIF) and Total Recordable Injury Frequency (TRIF), underscored their dedication to operational excellence.
Future Outlook
Looking ahead, Equinor maintains a positive outlook with stable organic capital expenditures projected around USD 13 billion for 2024. The company continues to focus on both traditional oil & gas production and expanding its renewables footprint, indicative of its balanced approach to growth and sustainability.
Conclusion
Equinor’s Q2 2024 performance presentation was a masterclass in effective communication. Through strategic design, structured content, and engaging visuals, Equinor not only highlighted its current successes but also instilled confidence in its future trajectory. The company’s dedication to innovation, operational safety, and shareholder returns positions it as a leader in the energy sector.


