Slidegenius, Inc.

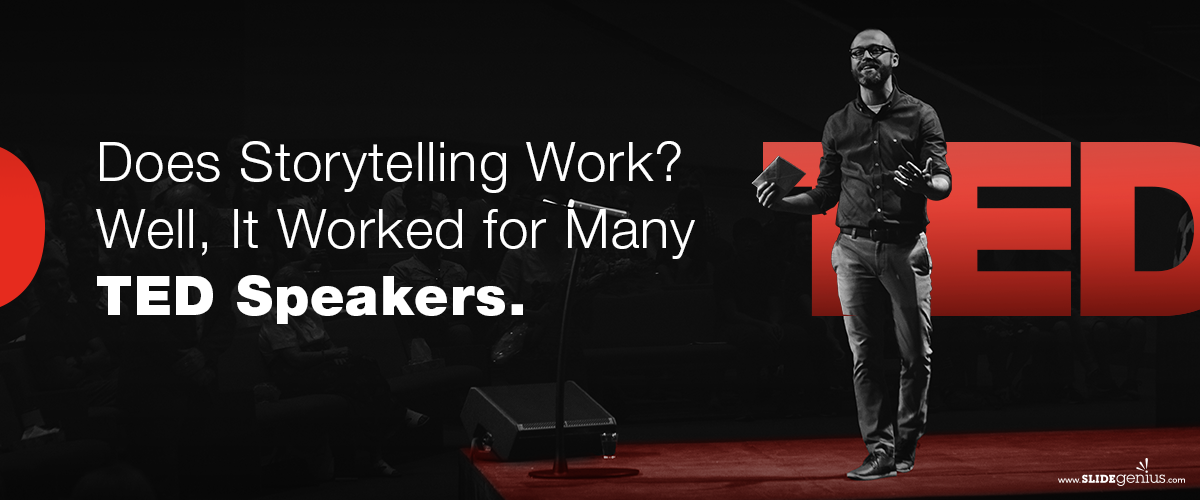
Does Storytelling Work? Well, It Worked for Many TED Speakers

Storytelling is the best way to engage your audience during a presentation.

Apart from a custom PowerPoint, it’s important that you establish a connection and elicit powerful emotions. This allows your audience to relate to and understand the need for your products and services because you’ve gone through the same thing at some point in your life.

TED speakers are some of the best people to ask when it comes to the most effective public speaking tips. They tell stories, which is the core of their mission during each presentation. Telling stories, after all, is one of the most effective forms of communication.

Human rights attorney and public speaker Bryan Stevenson has received the longest standing ovation ever given at a TED Talk. Carmine Gallo from Harvard Business Review shares that when he asked Steven about his speaking style, he says that he imagines talking to a friend over dinner, talking at an average of 190 words per minute, as compared to a motivational speaker who may go at 220 words per minute.

That said, he must have had something up his sleeve if he’s capable of coaxing his audience to a lasting standing ovation.

In March 2012, Stevenson held a TED Talk called We Need to Talk About an Injustice. Here, he talks about his grandmother and other people in his life, allowing him and the audience to establish a personal connection. What made it successful was its emotional arc—a compelling story of overcoming a relatable struggle.

If you don’t have a personal experience to share with your audience, tell them stories about real people—previous customers that have benefited from your company. Relevant real-life case studies are irresistible because the audience knows these are from other customers and not just opinions based on your thoughts alone.

Does your brand have an interesting origin story? You never know, this could be engaging and entertaining, like Airbnb’s—three guys making a few bucks by letting attendees at a local conference sleep at their place. Not only did this pay for the steep rent, but it also sparked a $30 billion-dollar idea.

TED Talks have stood out as an effective medium because it provides extensive information that’s easy to understand. But what else makes TED Talks special? Carmine Gallo boils its core elements down to three. He notes that the success of these presentations can be attributed to these three qualities:

  • Emotional
  • Novel
  • Memorable

Apart from these, top quality visuals are also necessary in engaging the audience. Consider consulting with PowerPoint presentation experts, it will prove a valuable step in the long term, especially for sales pitches.

Can you imagine having the power of TED speakers during presentations? To engage people until the end, making memorable pitches every time?

Storytelling is an art—an effective presentation technique. With passion, novel ideas, and memorable delivery, you’ll be able to pitch like a TED speaker. Keep these in mind and rehearse, rehearse, rehearse!

How to Think Like $5.99 and Not Like $6.00

Imagine you own a clothing store. Now you decide to begin a sale for that store. Let’s say a particular type of shorts usually costs $20 per short, but for the purposes of the sale you’re going to mark them down to $15 a piece.

There are two ways you could present that discount. The first would be as a percentage. Going from $20 to $15 would be 25% off. The second would be as an absolute number with $5 off. Which way is better?

Both discounts amount to the same final price. 25% off $20 and $5 off $20 both result in the customer paying $15 for the shorts. So both representations of the discount should have the same effect, right?

Wrong. Jonah Berger, author of Contagion, explains to us that the consumers find the 25% discount more attractive than the 5$ off. While the two discounts are the same economically, they don’t trigger the same psychological effect. One feels like a larger discount than the other.

Accordingly, the next time you’re reporting numerical information, pay attention to how you are presenting it. The way changes are represented can have a big impact on how they’re perceived.

Focus on the final number.

Like the story above, most people seemed to be more enticed by the offer when the discount number was larger. Rule of thumb would be whenever you are offering a discount under $100 display it as a percentage, and when the offer is greater than $100 display it as an absolute number. This will make sure you are always maximizing your psychological impact. Simpler is better. No one cares about a page of numbers and figures that look like the green screen display from the matrix. You need to simplify your results, and then simplify them again. Think of your raw data as a pile of freshly picked vegetables. People don’t want to eat them when they still have dirt and leave stems on them. People want a quick and painless way to stay healthy, so what do you do? You take those vegetables, clean them, cut them, put them in a blender and make a smoothie. Then you take that smoothie and turn it into a wheatgrass shot. Quick and to the point. So yes, your data should be reduced to the size of a wheatgrass shot! After all, the simpler your can represent your findings, the easier it will be for your audience to understand you, which will in turn make your call-to-action more successful.

Tell a story.

Everyone knows the best stories are the ones told with pictures, so use them. Portraying data graphically reveals patterns in the data that are hard to notice otherwise Visual depictions of data are almost universally understood without requiring knowledge of a language. It is also useful to alter your tone and speed as you approach the finding of any given graph. Much like when telling a story, the storyteller tends to get really excited toward the climax or “best part” of the story; it is not only useful but critical to draw attention to the most important features of the data.

I’ll leave you with Hans Rosling’s fascinating TED talk revolved around displaying data effectively, which you can watch here


References:

Berger, Jonah. “Fuzzy Math: What Makes Something Seem Like A Good Deal?linkedin. August 28, 2013.

Kakutani, Michiko. “Mapping Out the Path to Viral Fame.The New York Times. February 25, 2013.

Rosling, Hans. “The Best Stats You’ve Ever Seen.ted.com. February 2006.

-->