How can slide design enhance clarity when presenting complex clinical trial data?
Effective slide design plays a crucial role in enhancing clarity, especially when presenting complex clinical trial data. By utilizing a structured layout, you can guide your audience through the information in a logical and engaging manner. Start by breaking down the data into digestible segments—use bullet points to highlight key findings and avoid overwhelming viewers with excessive text. Visual aids such as graphs, charts, and infographics can illustrate trends or comparisons clearly, making complex information more accessible.
Color coding is another useful technique; it helps differentiate between various categories or outcomes within your data set. Additionally, incorporating consistent fonts and sizes ensures that your slides are easy to read from any distance. Remember that whitespace is not just empty space; it helps reduce clutter and emphasizes important elements on each slide.
To further enhance understanding, consider using animations judiciously to reveal information step-by-step rather than all at once, allowing for better retention of the presented material. Lastly, always tailor your design choices to align with the audience’s level of expertise—this ensures that even intricate details are communicated effectively without losing engagement.
View Our Presentation Portfolio
How can infographics enhance the effectiveness of presentations for startup product pitches?
Infographics can significantly enhance the effectiveness of presentations for startup product pitches by simplifying complex information and making it visually engaging. Startups often need to convey intricate ideas, data, or processes that can be overwhelming if presented solely in text format. By incorporating infographics, you can distill this information into digestible visuals that highlight key points, making it easier for your audience to understand and retain the message.
Moreover, infographics leverage the power of storytelling through visual elements. They help create a narrative flow in your presentation by connecting various pieces of information cohesively. This not only keeps the audience engaged but also helps them grasp how different aspects of your product interrelate.
Additionally, using well-designed infographics can elevate the perceived professionalism of your pitch. A polished visual representation demonstrates that you have invested time and thought into crafting your message, creating a positive impression on potential investors or clients.
Finally, incorporating data visualization through infographics allows you to present metrics and statistics effectively. Rather than bombarding your audience with numbers alone, charts and graphs allow for immediate recognition of trends or insights important to understanding your startup’s potential impact.
View Our Presentation Portfolio
What innovative slide design techniques can enhance the presentation of complex financial data in business meetings?
Innovative slide design techniques can significantly enhance the presentation of complex financial data in business meetings, allowing audiences to grasp intricate information quickly and effectively. Here are several strategies to consider:
- Data Visualization: Utilize charts, graphs, and infographics to transform numerical data into visual formats that are easier to understand. Techniques like heat maps or bubble charts can highlight trends and comparisons effectively.
- Storytelling Approach: Structure your slides as a narrative. Start with a compelling introduction that outlines the key points you want your audience to retain. This helps contextualize the data rather than presenting it in isolation.
- Simplified Text: Minimize text on slides by using bullet points or concise statements that summarize key insights instead of overwhelming viewers with dense paragraphs of information.
- Cohesive Color Schemes: Employ consistent color palettes that not only align with your brand but also serve functional purposes—like using contrasting colors for different data sets—making it easier for viewers to distinguish between them.
- Anatomy of Design Elements: Make use of white space strategically around graphs and images, allowing important elements room to breathe while enhancing readability and focus on critical information.
- Dynamism Through Animation: Introduce subtle animations or transitions when presenting data—such as revealing one point at a time—to guide the audience through complex information without causing confusion.
- User Interaction Tools: Incorporate interactive elements such as clickable graphs or embedded polls within digital presentations that allow participants to engage actively with financial metrics during discussions.
This combination of innovative techniques will not only clarify complex financial concepts but also engage your audience more effectively during business meetings. By focusing on clarity and interaction, you’ll ensure that important insights resonate long after the presentation ends!
View Our Presentation Portfolio
How can innovative slide design enhance the impact of presenting disruptive tech strategies in family businesses?
Innovative slide design plays a crucial role in enhancing the impact of presentations, especially when addressing disruptive tech strategies within family businesses. By utilizing creative visuals, engaging layouts, and strategic use of color and typography, presenters can effectively capture the audience’s attention and facilitate better understanding of complex concepts. Innovative designs allow for the incorporation of infographics that simplify data interpretation, making it easier for stakeholders to grasp essential information quickly. Additionally, incorporating storytelling elements through slides helps convey a narrative that resonates with family business values while addressing modern challenges posed by technology disruptions.
Moreover, well-designed slides can enhance emotional engagement by using imagery that reflects the company’s legacy alongside futuristic tech solutions. This duality not only honors tradition but also showcases adaptability and forward-thinking—key attributes necessary for thriving in today’s fast-paced market. Ultimately, innovative slide design transforms standard presentations into dynamic storytelling experiences that inspire action and foster collaboration among family members in business discussions.
View Our Presentation Portfolio
How can innovative slide design enhance the communication of financial performance data in business presentations?
Innovative slide design plays a crucial role in enhancing the communication of financial performance data during business presentations. By utilizing visually appealing elements such as graphs, charts, and infographics, presenters can transform complex data into easily digestible information. Effective use of color schemes and typography not only captures the audience’s attention but also helps emphasize key metrics and trends. For instance, employing contrasting colors for different data points can make comparisons clearer, while consistent use of fonts maintains a professional appearance throughout the presentation.
Furthermore, innovative slide designs facilitate storytelling by guiding the audience through financial narratives. By structuring slides to lead logically from one point to another—using transitions that mirror the progression of financial growth or decline—audiences are more likely to grasp underlying concepts and implications. Interactive elements like clickable charts or embedded videos can also engage viewers further, encouraging them to explore deeper insights.
In summary, a thoughtfully designed presentation not only conveys important financial performance data but does so in a manner that is engaging and memorable for stakeholders. This approach ultimately fosters better decision-making based on clear visual representations of essential information.
View Our Presentation Portfolio
How can engaging infographics enhance a CEO’s presentation on maximizing AI value in 2024?
Engaging infographics play a crucial role in enhancing a CEO’s presentation on maximizing AI value in 2024 by transforming complex data into visual narratives that are easily digestible. In today’s fast-paced business environment, decision-makers often face information overload. Infographics succinctly summarize key points, making it easier for the audience to grasp essential insights quickly. By utilizing striking visuals combined with impactful statistics, these graphics not only capture attention but also facilitate better retention of information.
Moreover, well-designed infographics can illustrate trends and predictions regarding AI advancements, showcasing their potential impact on business operations and strategy. This visual storytelling approach enables CEOs to communicate intricate ideas more effectively and engage their audience on an emotional level, fostering a deeper understanding of how AI can create value.
Additionally, integrating infographics into presentations allows for smoother transitions between topics while maintaining audience interest. The combination of colors, shapes, and typography can evoke specific feelings that reinforce the message being delivered about innovation and growth through AI technologies.
In summary, when used strategically within a presentation about maximizing AI’s value in 2024, engaging infographics elevate communication by clarifying concepts, enhancing memorability, and ultimately driving home the importance of embracing artificial intelligence for future success.
View Our Presentation Portfolio
How can engaging slide designs enhance audience retention during business presentations?
Engaging slide designs play a crucial role in enhancing audience retention during business presentations. When slides are visually appealing, they capture attention and stimulate interest, making it easier for the audience to focus on the content being presented. Effective use of color, typography, and imagery can create a dynamic visual experience that reinforces key messages without overwhelming viewers with excessive text or cluttered layouts.
Additionally, well-structured slide designs that incorporate elements like charts, infographics, and bullet points help distill complex information into digestible formats. This clarity aids understanding and allows the audience to grasp core concepts quickly. By using storytelling techniques combined with compelling visuals, presenters can create an emotional connection with their audience—further enhancing retention as stories tend to resonate more than mere facts.
Moreover, interactive elements such as polls or questions integrated within the presentation encourage participation and engagement from attendees. This interaction not only keeps the audience alert but also helps reinforce learning through active involvement in the discussion.
In summary, engaging slide designs foster an environment conducive to learning by maintaining attention levels high while simplifying information processing—ultimately leading to improved retention of ideas presented during business meetings or conferences.
View Our Presentation Portfolio
How can you effectively present forward-looking statements in business slides for maximum clarity and impact?
Effectively presenting forward-looking statements in business slides is crucial for ensuring clarity and impact. Start by clearly defining the purpose of your forward-looking statements. Use straightforward language to articulate your projections, emphasizing key metrics that support your claims. Visual aids such as graphs and charts can significantly enhance understanding; they transform complex data into digestible visuals, allowing your audience to grasp trends and forecasts at a glance.
When crafting these slides, employ a structured format: begin with an introduction that outlines the context of the statement, followed by the actual projections supported by relevant data points. Highlight assumptions behind these statements to provide transparency; this builds trust with your audience. Additionally, utilizing bullet points can help in breaking down information into manageable parts while maintaining focus on essential aspects.
Consider adding a risk assessment section that addresses potential challenges or uncertainties associated with these forecasts. This not only shows thoroughness but also prepares stakeholders for possible outcomes. Finally, end with a summary slide reiterating key takeaways from your presentation to reinforce retention of critical information.
View Our Presentation Portfolio
How can incorporating slow-motion techniques enhance the storytelling in your business presentations or infographics?
Incorporating slow-motion techniques into your business presentations or infographics can significantly enhance storytelling by allowing the audience to absorb critical information at a more digestible pace. This method is particularly effective when emphasizing key points, creating a dramatic impact, or showcasing intricate details that might otherwise go unnoticed in real-time. By deliberately slowing down specific moments, you create opportunities for reflection and contemplation among viewers, which fosters greater understanding and retention of the content being presented.
Moreover, slow-motion can effectively evoke emotions by highlighting expressions and reactions during significant moments. In an infographic context, this technique can be utilized to draw attention to important statistics or data trends that require careful consideration. For instance, animating data transitions in slow motion allows viewers to process changes over time more thoroughly—making complex information feel accessible rather than overwhelming.
Additionally, using this technique strategically within your presentation design helps maintain audience engagement by breaking up fast-paced visuals with measured pauses that invite deeper focus on particular aspects of your narrative. Altogether, integrating slow-motion elements not only elevates aesthetic appeal but also enriches the overall communication strategy of your business messaging.
View Our Presentation Portfolio
How can infographics enhance the effectiveness of presentations for school fundraising initiatives like Box Tops for Education?
Infographics serve as a powerful tool in enhancing the effectiveness of presentations, particularly for school fundraising initiatives such as Box Tops for Education. By transforming complex data into visually appealing graphics, infographics simplify information and make it more digestible for your audience. They can highlight key statistics about fundraising goals, showcase progress in a fun way, and illustrate how funds are utilized within the school community.
Incorporating infographics into your presentation helps capture attention quickly; vibrant colors and engaging visuals stand out against traditional text-heavy slides. This visual engagement is crucial when seeking support from parents or community members who may not be familiar with all aspects of the initiative but want to understand its impact at a glance.
Moreover, infographics facilitate storytelling by connecting emotionally with viewers through relatable imagery and concise messaging. For example, showing before-and-after scenarios related to programs funded by Box Tops can create an emotional connection that motivates attendees to contribute.
The strategic use of infographics also encourages sharing on social media platforms or during meetings—making them ideal tools not just for presentations but also for extending outreach efforts beyond initial discussions.
View Our Presentation Portfolio
What Presentation Design Techniques Did Matson Use to Communicate Q4 2022 Earnings Success?
Strategic Presentation Design and Structure
The design and structure of Matson’s presentation played a crucial role in delivering an impactful message. The presentation was logically organized, beginning with an overview of the company’s financial health, followed by detailed insights into the performance of its key segments: Ocean Transportation and Logistics. This straightforward structure allowed stakeholders to easily follow the narrative and understand the company’s financial standing.
Emphasis on Key Segments
By methodically highlighting the strong performance of the Ocean Transportation and Logistics segments, Matson effectively positioned itself as a resilient player in the industry. The presentation emphasized significant cash returns to shareholders and the strength of its capital construction fund, reinforcing confidence in its long-term strategic goals.
Impactful Visuals
Visual elements were meticulously integrated to enhance understanding and retention of key information. Charts and graphs clearly depicted financial data, showcasing the positive cash flow and capital management strategies. These visuals were not only aesthetically pleasing but also served to break down complex information into digestible parts, making the presentation accessible to a broad audience.
Clear and Optimistic Messaging
Throughout the presentation, Matson maintained a positive and forward-looking tone, despite acknowledging current challenges. The messaging was clear and optimistic, outlining the company’s anticipation of continued economic growth in Hawaii, Alaska, and Guam. Matson communicated its commitment to financial discipline and strategic growth, which included plans for organic growth and potential acquisitions.
Addressing Challenges with Confidence
While the presentation did not shy away from discussing lower year-over-year volumes and freight rates, particularly in its China service, it balanced this with a confident outlook for improved trade dynamics in the latter half of the year. This balanced messaging reassured stakeholders of Matson’s ability to navigate economic uncertainties, such as inflation and higher interest rates.
Commitment to Shareholders
The presentation also highlighted Matson’s proactive approach in returning capital to shareholders, showcasing significant share repurchases over the past two years. This not only underscored the company’s financial health but also its commitment to delivering value to its investors.
Conclusion
Overall, Matson’s Q4 2022 earnings presentation was a masterclass in effective communication. Through strategic design, structured content delivery, impactful visuals, and positive messaging, Matson successfully conveyed its solid financial performance and optimistic future outlook. The presentation reassured stakeholders of Matson’s resilience and strategic vision, setting a strong foundation for future growth and success.
Category: business-presentationWhat Presentation Design Techniques Does OneSpan Use to Convey Q3 2023 Investor Insights?
Strategic Initiatives and Financial Performance
At the heart of OneSpan’s presentation is the emphasis on strategic initiatives like operational excellence and cost reduction measures. The company is taking bold steps to refine its cost structure and maximize shareholder returns through a “Dutch auction” tender offer aimed at repurchasing $20 million of its common stock. This strategic move is not only financially savvy but also signals OneSpan’s dedication to returning capital to its shareholders.
Design and Structure
The presentation’s design is both sleek and professional, utilizing a consistent color scheme and clean typography to ensure that the information is easily digestible. The structure is logically organized, guiding the audience through OneSpan’s vision and mission, solution portfolio, financial metrics, and future outlook. Each section builds upon the last, creating a cohesive story that is easy to follow.
Visuals and Messaging
Visuals play a crucial role in reinforcing OneSpan’s messaging. Charts and graphs are used effectively to illustrate the company’s positive financial metrics, such as revenue growth and increased annual recurring revenue (ARR). These visuals not only provide clarity but also underscore the company’s robust performance in Q3 2023. The messaging is clear and optimistic, projecting confidence in OneSpan’s ability to meet its ambitious 2024 financial targets.
Core Content and Market Position
OneSpan’s core content centers around its vision to create a world of trusted digital interactions and its mission to enhance customers’ digital revenue streams through secure, compliant digital agreement lifecycles. This is achieved through its flagship offering, the OneSpan Transaction Cloud Platform, which provides advanced services like risk-based verification and secure virtual collaboration. Serving sectors such as banking, financial services, and healthcare, OneSpan’s diverse customer base and global market presence solidify its position as a leader in the digital agreements market.
Conclusion
In summary, OneSpan’s Q3 2023 Investor Presentation is a testament to the company’s strategic foresight and operational acuity. Through a combination of strategic initiatives, effective design, and clear messaging, the presentation not only communicates OneSpan’s current successes but also paints a promising picture for the future. It is a powerful tool that aligns stakeholders with the company’s vision, building trust and enthusiasm for the journey ahead.
What Presentation Design Techniques Does TAG Immobilien AG Use to Convey Key Info in FY 2022?
Design and Structure: Clarity in Communication
The presentation’s design was meticulously crafted to guide the audience smoothly through TAG’s achievements and future plans. Each section was logically structured, beginning with a comprehensive overview of the FY 2022 performance, followed by detailed insights into operational successes, financial strategies, and future outlooks. This structured approach ensured that stakeholders could easily follow the narrative, reinforcing the company’s commitment to transparency and clarity.
Visuals: Enhancing Engagement and Understanding
TAG Immobilien AG employed impactful visuals to complement the presentation’s content. Graphs illustrating rental growth, vacancy rate reductions, and financial health metrics were effectively utilized to provide a clear, visual representation of the company’s achievements. In addition, images of developments in Germany and Poland served to highlight TAG’s growth and expansion efforts, making the data more relatable and engaging for the audience.
Messaging: Delivering a Positive and Strategic Narrative
The presentation’s messaging was carefully crafted to emphasize TAG’s strategic accomplishments and future-ready positioning. By focusing on key achievements, such as significant rental growth in the German portfolio and a strong development pipeline in Poland, TAG highlighted its operational excellence. Additionally, the decision to suspend the FY 2022 dividend was framed positively as a strategic measure to safeguard liquidity, showcasing the company’s prudent financial management.
Core Content: Operational Success and Financial Strategies
TAG Immobilien AG reported notable rental growth within its German portfolio, achieved through effective management strategies that reduced vacancy rates and increased rental income. In Poland, TAG’s focus on build-to-sell projects led to higher disposal volumes and enhanced self-funding capabilities, reflecting the company’s strategic foresight in capital utilization. Despite challenges such as higher refinancing costs, TAG’s financial health was underscored by successful refinancing measures and a robust liquidity position.
Strategic Outlook for FY 2023
Looking forward, TAG Immobilien AG maintains a positive outlook for FY 2023. The company projects FFO I and FFO II within targeted ranges, demonstrating confidence in its strategic direction despite anticipated challenges. TAG continues to prioritize sustainable growth and efficient capital use, supported by strong ESG ratings. By managing a substantial German residential portfolio while expanding in Poland, TAG is well-positioned for future stability and growth.
Conclusion: A Presentation That Inspires Confidence
TAG Immobilien AG’s FY 2022 presentation stands as a testament to the power of thoughtful design, strategic visuals, and clear messaging in communicating a company’s vision and achievements. The presentation not only highlighted TAG’s operational success and strategic financial maneuvers but also inspired confidence in its future prospects. With a focus on sustainable growth and disciplined financial management, TAG is poised for continued success in the years ahead.
Category: business-communicationWhat Presentation Design Techniques Does Wabtec Use to Communicate Key 2023 Achievements?
Wabtec’s First Quarter 2023: A Testament to Strategic Excellence and Financial Resilience
The first quarter of 2023 was a pivotal period for Wabtec, showcasing a remarkable blend of financial strength and strategic progression against a backdrop of global economic volatility. Let’s delve into how the presentation’s design, structure, visuals, and messaging effectively communicated Wabtec’s achievements and future outlook.
Engaging Presentation Design and Structure
Wabtec’s Q1 2023 presentation was meticulously designed to captivate and inform its audience. The structure followed a logical progression, starting with a comprehensive overview of key financial metrics, followed by detailed insights into strategic milestones and future aspirations. This clear and organized approach ensured that stakeholders could easily follow the narrative and appreciate the company’s performance and strategic direction.
Visuals that Enhance Understanding and Impact
Visual aids played a crucial role in the presentation, with charts and graphs illustrating significant growth in sales, particularly in the Freight segment, and the achievement of higher operating margins. These visuals not only made complex financial data more accessible but also highlighted the efficiency of Wabtec’s cost management strategies.
Key Highlight: Record-High Backlog
One of the standout visuals was a graph depicting Wabtec’s record-high backlog, providing stakeholders with strong multi-year visibility and underscoring the company’s robust order book.
Compelling Messaging and Strategic Wins
The messaging throughout the presentation was clear and positive, emphasizing Wabtec’s resilience and adaptability in a challenging economic landscape. Key strategic wins, such as new locomotive orders in Brazil and a milestone delivery to Indian Railways, were prominently featured, highlighting Wabtec’s global market presence and operational strength.
Focus on Innovation and Sustainable Growth
Wabtec’s commitment to innovation, particularly in decarbonization and expanding high-margin recurring revenue streams, was a recurring theme. The company articulated its strategic focus on these areas, underscoring its dedication to sustainable growth and long-term value creation for stakeholders.
Positive Financial Outlook and Shareholder Value
The presentation concluded with a positive outlook for 2023, projecting continued revenue growth, strong cash flow conversion, and disciplined capital deployment. Wabtec’s improved leverage and substantial liquidity were highlighted as key enablers of future growth and shareholder value maximization.
Conclusion
In summary, Wabtec’s first quarter of 2023 presentation was a masterclass in effective communication. Through strategic design, impactful visuals, and compelling messaging, Wabtec not only showcased its financial and strategic achievements but also reinforced its commitment to innovation, sustainability, and stakeholder value. As Wabtec moves forward in 2023, its focus on operational efficiency and strategic growth positions it well to navigate future challenges and opportunities.
Category: business-communicationWhat Presentation Design Techniques Does BlackRock Use to Highlight Investment Insights?
Strategic Preference for Private Credit
The latest commentary from BlackRock Investment Institute offers a thorough analysis of current financial trends, providing investors with strategic insights aimed at optimizing returns in an evolving economic environment. The presentation’s design and structure are crafted to deliver a clear and impactful message, focusing on the strategic preference for private credit over public credit, alongside other investment recommendations.
Equities: Public Stocks Over Private Equity
In terms of equities, the presentation leans towards public stocks instead of private equity. This preference is based on the assertion that public markets have already factored in current risks, and the medium-term outlook is more favorable. The narrative is supported by clear, data-backed visuals that depict market adjustments and risk assessments, aiding investors in comprehending the complex landscape of public equities.
Inflation and Economic Outlook
The analysis also addresses the persistent inflation above policy targets, driven largely by wage pressures and worker shortages. This economic insight is crucial for understanding why rate cuts are not anticipated this year. The presentation uses a blend of historical data and future projections to effectively communicate these insights, helping investors align their strategies with economic realities.
Investment Recommendations
BlackRock suggests a cautious approach towards developed market equities due to recession risks, advocating instead for a focus on short-term government bonds to generate income. The report further emphasizes the value of inflation-linked bonds and private credit. Each recommendation is supported by visual aids and structured messaging that clarifies the rationale behind these strategic choices.
Conclusion
Overall, BlackRock’s insights provide a nuanced approach to navigating today’s financial markets. The presentation’s design, structure, and messaging work in tandem to deliver a clear, impactful message that empowers investors to make well-informed decisions. By combining strategic preferences with visual clarity and data-driven analysis, BlackRock effectively guides investors in optimizing their portfolios amidst economic complexities.
This output retains the core content while removing unnecessary HTML elements and inline styles, ensuring compatibility with WordPress themes.
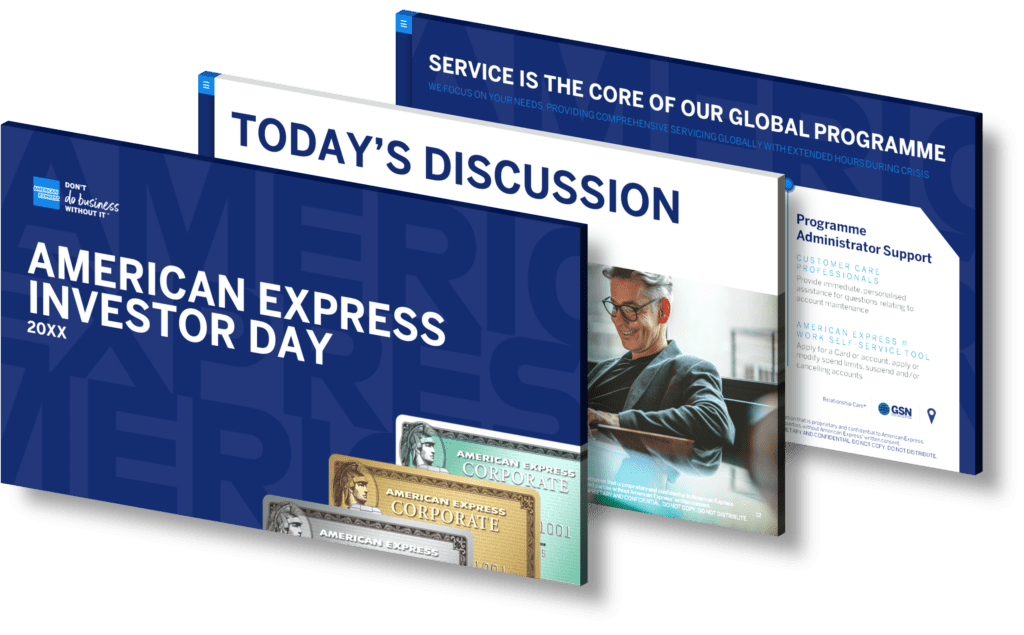
Category: custom-presentationWhat presentation design techniques does American Express use to convey Q3 2023 growth?
Effective Presentation Design and Structure
The presentation of American Express’s Q3 financial results was meticulously designed to ensure clarity and impact. The structure was logical, beginning with an overview of the impressive financial metrics and then delving into specific areas of growth. This approach allowed stakeholders to quickly grasp the overall success before exploring the details of each contributing factor.
Strategically placed graphs and charts were utilized to visually represent data, making complex financial information accessible and easy to understand. This visual storytelling was crucial in highlighting the company’s achievements and future prospects.
Visuals and Messaging: Key Contributors to a Clear Message
The use of visuals in the presentation was not only aesthetically pleasing but also functionally effective. Key metrics such as the increase in total revenues net of interest expense, and the rise in net interest income were depicted through engaging infographics. These visuals helped in accentuating the growth trajectory and demonstrating the positive impact of higher billed business and net card fees.
The messaging throughout the presentation was positive and forward-looking. It emphasized American Express’s strengths in the U.S. and international markets, particularly in the Travel & Entertainment (T&E) and Goods & Services (G&S) segments. By focusing on these areas, the presentation underscored the strategic initiatives that have positioned American Express for sustained growth.
Core Content Highlights
American Express’s Q3 2023 results were driven by several key factors:
- Revenue Growth: A notable increase in total revenues, net of interest expense, was achieved through higher billed business and net card fees. This growth was evenly spread across both U.S. and international markets.
- Net Interest Income: There was a significant rise in net interest income, a result of higher interest rates and increased revolving loan balances, which bolstered the overall financial performance.
- Expense Management: Despite increased spending on card member rewards and business development, operating expenses were effectively controlled. A strategic reduction in marketing expenses was implemented to optimize investment spending.
- Stable Credit Metrics: Credit metrics remained stable, with manageable levels of net write-offs and past-due loans, reflecting a healthy credit environment.
Positive Outlook and Future Prospects
Looking ahead, American Express maintains a positive outlook for the future. The company anticipates continued revenue growth and mid-teens EPS growth. This optimistic forecast is supported by ongoing investments in enhancing customer value propositions and expanding digital capabilities.
In conclusion, American Express’s Q3 2023 financial performance presentation was a masterclass in delivering a clear and impactful message. Through effective design, strategic structure, and compelling visuals, the company successfully communicated its achievements and future potential, reinforcing its position as a leader in the financial sector.
Category: business-analysisWhat Presentation Design Techniques Did Myriad Genetics Use to Convey Key Insights at Raymond James 2023?
Design and Structure of the Presentation
The presentation was meticulously designed to convey Myriad’s strategic initiatives and achievements effectively. The structured format allowed for a seamless flow of information, ensuring that each segment of the presentation built upon the previous one, thus creating a comprehensive narrative of Myriad’s journey and future aspirations.
Clear and Impactful Messaging
Myriad Genetics emphasized its core mission of empowering individuals and healthcare providers through personalized risk assessments and informed treatment decisions. This clear messaging was reinforced by their extensive portfolio of tests like MyRisk and GeneSight, which serve as pivotal tools in transforming patient care.
Myriad’s strategic focus on growth and innovation was underscored by their efforts in enhancing commercial capabilities, expanding product offerings, and investing in cutting-edge lab infrastructure. These initiatives are central to Myriad’s vision of advancing health and well-being through genetic insights.
Visuals and Engagement
Visual elements were strategically used to enhance understanding and retention of key information. Graphs and charts illustrated Myriad’s growth trajectory and market influence, while visual storytelling helped emphasize the human impact of their genetic testing solutions. The use of patient testimonials and case studies further engaged the audience, bringing emotional resonance to the scientific advancements discussed.
Core Content and Strategic Focus Areas
The presentation delved into Myriad’s strategic focus areas: Women’s Health, Oncology, and Mental Health. By addressing these crucial aspects of health, Myriad is not only expanding its market reach but also ensuring that its innovations have a wide-reaching and meaningful impact. The company’s commitment to these areas is evident in their robust pipeline of new products designed to meet evolving healthcare needs.
- Women’s Health: Myriad is at the forefront of developing genetic tests that provide critical insights into hereditary breast and ovarian cancer, enabling proactive health management.
- Oncology: Through advanced genetic testing, Myriad aids in the early detection and treatment of various cancers, including prostate cancer, thereby improving patient outcomes.
- Mental Health: The GeneSight test is a testament to Myriad’s innovative approach in tailoring mental health treatments to individual genetic profiles, enhancing treatment efficacy and patient satisfaction.
Commitment to Future Growth
Myriad Genetics is strategically enhancing its commercial capabilities, streamlining operations, and fostering robust partnerships with healthcare providers. These efforts are pivotal in reinforcing their reputation as a leader in the genetic testing industry. Furthermore, their commitment to cost management and profitability positions them well for sustained success and industry leadership.
Conclusion
In conclusion, the presentation at the Raymond James 2023 Institutional Investors Conference highlighted Myriad Genetics’ unwavering commitment to advancing healthcare through innovative genetic testing solutions. Their strategic focus on growth, innovation, and patient-centric care ensures that they remain at the forefront of the genetic testing industry, delivering unparalleled value to patients and providers alike.
Category: presentation-designWhat Presentation Design Techniques Does Flutter Entertainment Use to Communicate Q1 2024 Growth?
Overview of Flutter Entertainment’s Financial Performance
Flutter Entertainment’s Q1 2024 earnings presentation stands as a testament to the company’s robust growth trajectory and strategic advancements. With a significant increase in revenue and Adjusted EBITDA, Flutter has demonstrated its capacity to navigate and thrive in diverse markets. This comprehensive earnings report offers insights into the company’s performance, highlighting key areas of growth and strategic initiatives that have fortified its position in the global online gaming industry.
Design and Structure: Crafting a Clear and Impactful Message
The presentation’s design effectively underscores the company’s achievements, with a clear, logical structure that guides the audience through the financial highlights and strategic developments. The use of infographics and charts enhances comprehension, allowing stakeholders to easily grasp complex data and trends. This visual approach not only solidifies the understanding of Flutter’s financial health but also emphasizes the company’s strategic priorities.
Visuals and Messaging: Emphasizing Strategic Leadership
The visuals employed in the presentation play a crucial role in highlighting Flutter’s leadership in the US market. By showcasing the substantial customer acquisition and engagement through innovative sports betting products, the presentation effectively communicates the company’s pioneering efforts in state launches like North Carolina. These visuals are complemented by concise messaging that underscores Flutter’s strategic focus and commitment to growth.
Core Content: Driving Growth Through Innovation and Expansion
The core content of the presentation delves into Flutter’s strategic advancements, particularly in the international arena. Acquisitions such as MaxBet have been pivotal in bolstering Flutter’s growth, enabling the company to expand its market share in key regions. Moreover, product innovations have played a significant role in enhancing Flutter’s competitive edge, further solidifying its standing in the global market.
The presentation also highlights Flutter’s diversified portfolio, which has shown remarkable resilience amidst varying economic conditions. Notable gains in average monthly players (AMPs) and improved financial metrics across different segments reflect the company’s strategic investments in technology and personalized content, driving long-term success and reinforcing its leadership in the online gaming industry.
Addressing Challenges: Operational Efficiency and Future Growth
While the earnings presentation acknowledges certain challenges, such as net losses due to specific charges, it also emphasizes Flutter’s high operational efficiency. The positive cash flow adjustments reported indicate healthy underlying business dynamics, setting the stage for future growth. This balanced approach ensures stakeholders are well-informed of both the challenges and the opportunities that lie ahead.
Conclusion: A Strong Foundation for Continued Success
In conclusion, Flutter Entertainment’s Q1 2024 earnings presentation effectively communicates a narrative of robust growth and strategic leadership. Through its well-crafted design, engaging visuals, and clear messaging, the presentation not only highlights the company’s financial achievements but also outlines a promising path forward. Flutter’s strategic investments and innovative approach position it as a frontrunner in the online gaming industry, poised for continued success in the coming quarters.
What Presentation Design Techniques Does Aris Water Solutions Use to Highlight Key Info?
Introduction to Aris Water Solutions, Inc.
Aris Water Solutions, Inc. stands as a trailblazer in the environmental water infrastructure sector, committed to providing sustainable solutions that empower energy companies to minimize their environmental impact. With a focus on treating complex wastewater for reuse and extracting valuable minerals, Aris is at the forefront of industry innovation.
Design and Structure of the Presentation
The presentation delivered by Aris Water Solutions was meticulously structured to convey a coherent and compelling narrative. Each section of the presentation was designed to build upon the previous one, creating a logical flow that helped the audience follow and understand the company’s strategic initiatives and achievements. The use of clear headings and subheadings provided easy navigation, ensuring that the core message was accessible and memorable.
Impactful Visuals
Visuals played a crucial role in enhancing the presentation’s impact. Aris utilized a blend of informative graphs, charts, and diagrams to illustrate key data points, such as the increase in produced water volumes and the year-over-year growth in Adjusted EBITDA. These visuals were not only aesthetically pleasing but also served to reinforce the company’s achievements and strategic goals in a manner that was easy to digest and retain.
Clear and Consistent Messaging
Aris’s presentation was anchored by a clear and consistent message of sustainability and innovation. This was articulated through a detailed discussion of their efforts to significantly reduce groundwater withdrawal and advance projects for the beneficial reuse of treated water. By highlighting these initiatives, Aris underscored its commitment to environmental stewardship and operational efficiency, resonating strongly with stakeholders who value sustainable practices.
Core Content and Strategic Focus
The core content of the presentation centered around Aris’s strong performance in the second quarter of 2024, marked by increased water volumes and impressive financial growth. The presentation effectively communicated the company’s strategic focus on high-return organic growth opportunities, disciplined acquisitions, and consistent shareholder returns. These elements were presented not just as financial metrics but as integral parts of Aris’s long-term vision for sustainable development.
Conclusion
Through a well-designed presentation rich with visuals and clear messaging, Aris Water Solutions successfully delivered an impactful message that highlighted its leadership in sustainable water solutions. The combination of strategic content and engaging design elements ensured that the audience left with a strong understanding of the company’s achievements and future objectives. This presentation not only reinforced Aris’s position as a key industry player but also demonstrated its unwavering commitment to enhancing environmental stewardship and operational efficiency.
Category: presentation-design
What Presentation Design Techniques Did Pharming Group NV Use to Communicate 2023 Achievements?
The presentation of Pharming Group N.V.’s financial results for the fourth quarter and full year 2023 was a masterclass in strategic communication, showcasing the company’s impressive strides towards becoming a leading global rare disease biopharma entity. Leveraging meticulous design, structured content, compelling visuals, and clear messaging, Pharming effectively communicated their significant progress and future ambitions.
Design and Structure: Clarity and Impact
The presentation was expertly structured to guide the audience through a narrative that not only highlighted past achievements but also painted a vivid picture of Pharming’s future. The logical flow of the presentation began with an overview of the financial results, followed by detailed insights into product performance, and concluded with strategic plans for pipeline expansion and innovation.
Each section was designed to build upon the previous, ensuring that stakeholders could easily follow the progression of Pharming’s business strategy. This clear structure ensured that the message was not only heard but understood, reinforcing the company’s commitment to transparency and strategic growth.
Visuals: Engaging and Informative
Visual elements played a critical role in enhancing the presentation’s impact. High-quality graphics and charts were used to illustrate financial data, market performance, and pipeline developments. These visuals were not only aesthetically pleasing but also served to simplify complex data, making it accessible to a broad audience.
The visuals supported the narrative by emphasizing key points such as the strong market performance of RUCONEST® and the successful U.S. launch of Joenja® (leniolisib). By visually representing these achievements, Pharming effectively communicated the significance of their accomplishments and their impact on revenue growth.
Messaging: Focused and Forward-Thinking
Pharming’s messaging throughout the presentation was both focused and forward-thinking. The emphasis on their flagship product, RUCONEST®, underscored its role as a cornerstone in treating acute hereditary angioedema (HAE) attacks. Despite increased therapy options, the product’s continued strong market performance and patient reliance were highlighted as testaments to its efficacy and importance.
The introduction of Joenja® (leniolisib) as the first FDA-approved treatment for activated phosphoinositide 3-kinase delta syndrome (APDS) was another pivotal message. The successful launch not only boosted Pharming’s revenue but also expanded their pipeline and development efforts, showcasing the company’s ability to innovate and lead in rare disease treatment.
Core Content: Strategic Commitment and Future Directions
At the core of the presentation was Pharming’s dedication to advancing internal projects and acquiring new assets in the rare disease space. The company’s focus on early to late-stage clinical programs across therapeutic areas such as immunology, hematology, respiratory, and gastroenterology was a testament to their strategic vision.
Ongoing regulatory reviews in multiple countries and investments in genetic testing initiatives further illustrated Pharming’s commitment to enhancing patient access to innovative treatments like Joenja®. Looking ahead, the company is poised for further developments with leniolisib for primary immunodeficiencies with immune dysregulation, emphasizing their proactive approach in addressing unmet medical needs.
Conclusion: A Presentation of Progress and Promise
In conclusion, Pharming Group N.V.’s 2023 financial results presentation was a powerful demonstration of their progress and potential in the rare disease biopharma sector. Through strategic design, engaging visuals, and focused messaging, Pharming effectively communicated their achievements and future ambitions, reinforcing their position as a leader in providing innovative solutions for rare diseases.
As Pharming continues to build on their successes and expand their pipeline, stakeholders can look forward to a future where the company’s innovative treatments have a transformative impact on the lives of patients worldwide.
Category: business-communication