Explaining how your company is organized and how you do business is tedious because there’s a lot on the list.
Keep them engaged by organizing ideas into easy-to-follow flowcharts and diagrams. These are more visual in nature, holding their interest long enough for you to get your point across.

Supplementing your business presentation with visuals is the key to simplifying an otherwise long and boring topic.
In this article, we cover the benefits of organizing your ideas into charts and diagrams to make your business presentation easier to understand.
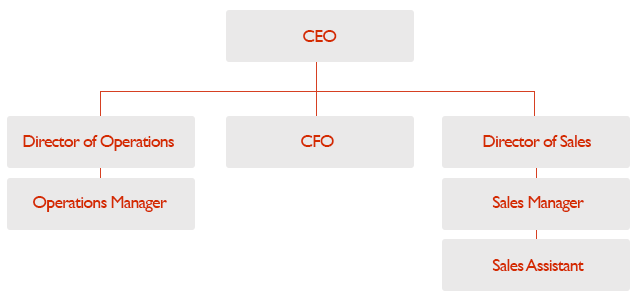
The Organizational Chart
An organizational chart is used to explain relationships between members of a group.
However, don’t just list down respective teams’ leaders to explain to your company’s organizational structure. Use this chart to show direct and indirect relationships between staff, managers, and executives.
With the organizational chart, information is displayed in a top-to-bottom format, usually with the CEO at the top. The chart branches out to show all the other people below the organization’s head. This gives everyone a clear picture of who reports to whom and who is responsible for what.
The catch is that organizational charts explain structure but not how a company operates. If you want to explain the how in your company operations, use flowcharts.
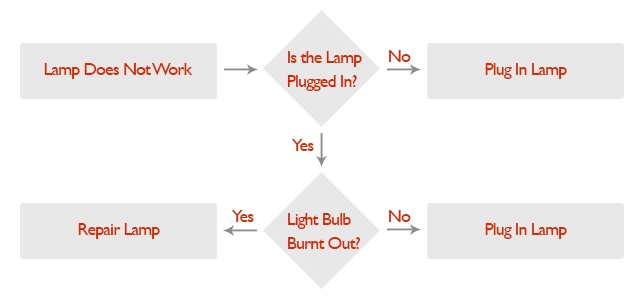
The Flowchart
Compared to an organizational chart, the flowchart can be linear, and sometimes circular in form.
It’s best for explaining processes, especially during business presentations. The flowchart builds a clear picture of where something begins, what happens in between and where it ends.
Start with your process’s beginning. When an order comes in, what step follows next? Is there a step where the request is evaluated?
Lay out your steps sequentially, then add if-and-then statements if something goes wrong with that step.
The more complicated a process is, the harder it is to illustrate with a flowchart. Stick to the basics and keep your illustrations simple.
—
These two charts are the most common ways to explain how a business is organized and how it operates.
Microsoft Office applications can easily render these charts which are often used for internal company orientations and business-to-business pitches. These conveniently illustrate structures and processes instead of talking about them with a wall of text.
Each chart has strengths and weaknesses, but you can rely on any of these types to simplify text-heavy explanations by visualizing the information.

Download free PowerPoint templates now.
Get professionally designed PowerPoint slides weekly.
Sign Up NowReferences:
Types of Graphs. Accessed May 14, 2015.
“The Art of Graphs and Charts.” SlideGenius, Inc. April 21, 2014. Accessed May 14, 2015.