Previously we talked about creating tables and charts manually in PowerPoint. However, not everyone has the luxury to pore over a Gantt chart they need to present the following morning. In its efforts to be even more user-friendly and efficient, Microsoft’s released a program made to craft your timeline in just two minutes, or less.
Need to create a timeline in Microsoft PowerPoint but don’t have the time to input the necessary shapes and tools separately? Then you may want to check out Microsoft’s add-in for easily crafting professional looking timelines.
An Efficient Program
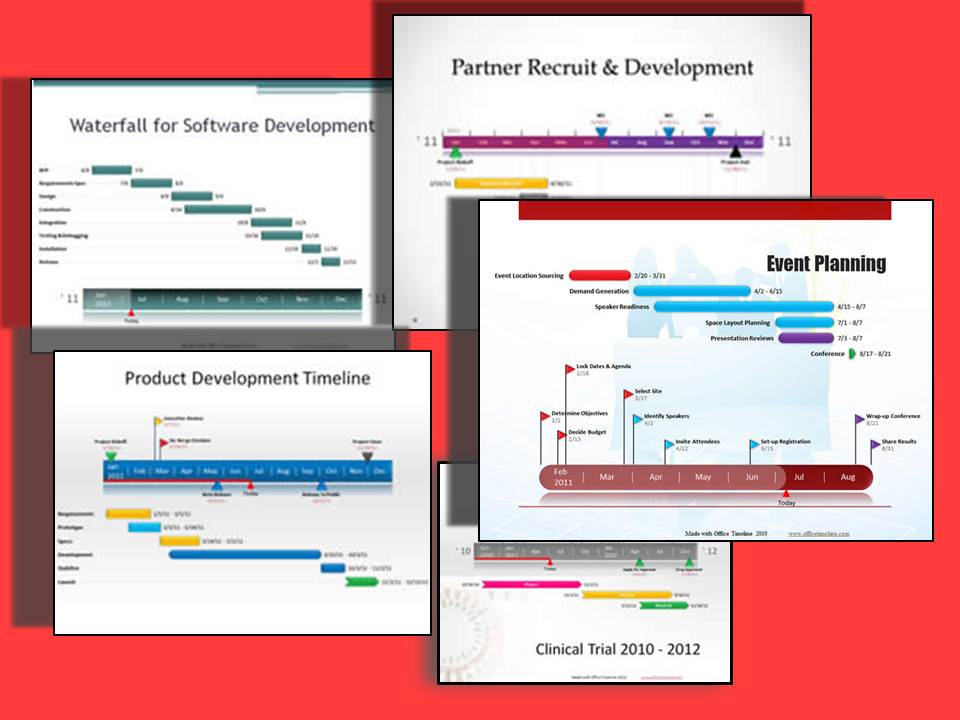
Office Timeline is designed for MS PowerPoint 2007, 2010, and 2013 and it works by enabling you to make your timeline and project slides quickly and easily. In fact, that’s its motto: Beautiful, Professional, Easy.
In just a few minutes, you’ll be able to create a beautiful and organized timeline on the slide that you can proudly present to management, team member, or customers. This user-friendly wizard will simply ask for data such as start and end dates along with some descriptions. In an instant, it will create a timeline slide in your open presentation.
How to Use
It doesn’t take much effort to craft a Gantt chart with this program. You can download the plug-in for free on Office Timeline’s official site, or buy the Plus Edition. Once you’ve installed it in your program, an Office Timeline tab will appear beside the usual tabs in PowerPoint.
Select New. This will present you with various types of timelines that you can choose from. This includes pre-set templates that you can customize later on to your advantage. After choosing the type of timeline you want to present, you’ll be asked to input Milestones, which are the markers of your chart. These can be as many as you want, depending on the number of items on your timeline. You can further tweak this feature’s color, date, and name to fit your purpose.
The Gantt chart will appear on the slide after you’ve fulfilled all the requirements for your timeline. Here, you can select the separate components of the chart — including its scale and markers.
Conclusion
Organizing your data into understandable and brief diagrams is the key to a painless presentation. Most people — possibly including your own audience, whether these are customers, investors, or the big bosses — are visual learners who learn best by being shown data and progress information, rather than by being exposed to droves of text and winding verbal explanations.
While your PowerPoint isn’t meant to be a replacement for your actual presence, it will help to have a visual aid that supports your points and compresses the most important of these into neat visual charts. Office Timeline is one of these charts, developed by Microsoft to answer the information overload that plenty of presenters often fall into.
Are you going to stick to boring, text-heavy slides, or will you upgrade to this sleek, efficient tool?
References
Office Timeline Software. Accessed May 16, 2014.