We previously featured several infographics to celebrate the Fourth of July. Have you noticed how infographics have been gaining momentum in recent years?
With the wealth of data now available to them, Internet users prefer how infographics can effectively break down the information they need in easy-to-comprehend illustrations. According to Kissmetrics, 40% of people are more likely to respond to visuals than plain text, making it clear why infographics can be a great tool to enhance your presentations.
However, there’s more to infographics than just slapping together numbers, pie charts, and quirky visuals. Aside from great design, an infographic needs to have significant and accurate content. It can do a lot to engage your audience. Marketing guru Jeff Bullas explains that if you’re posting infographics online, it can quickly gain you a new set of readers.
With so many eyes on your infographic, you need to make sure that you’re doing it correctly. Here are a few pointers to keep in mind:
Research Your Content
This is perhaps the most crucial part of making infographics. You won’t have anything to put in your infographic if you don’t do some research.
You don’t need to hit the library and read through scientific journals, but don’t just do a quick Google search either. Look for reliable sources and be critical of anything you find on the Internet. Cross reference any data you want to use with a different source.
Condense Information into an Interesting Story
Your infographics should also focus on telling a specific story. Tackling too many topics in one infographic will be confusing, especially if you plan to use it for a presentation. Instead, focus on answering just one question.
This infographic answers the question, “How much salt is in the food we eat?”
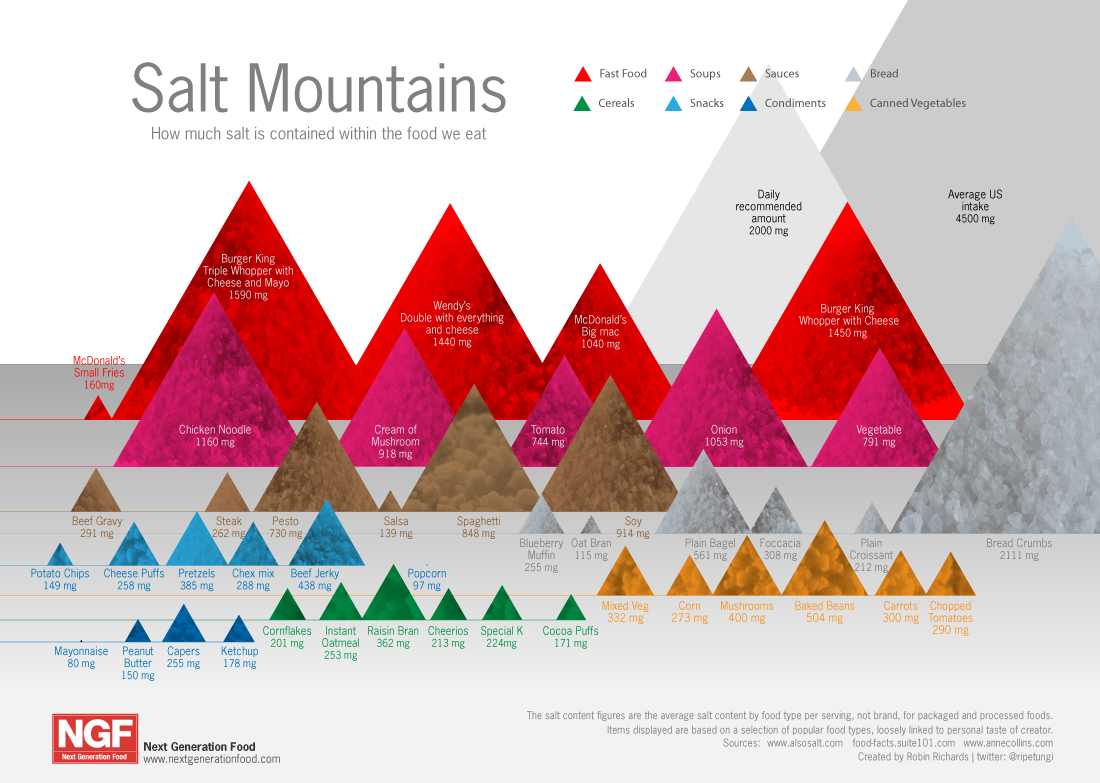
Aside from answering the question it poses, this infographic is also advocating a change in diet. A good story ends with a call of action. The same is true for an effective infographic.
Use Images that are Related to the Topic at hand
This might seem obvious, but it is truly important the images you use are related to the question you’re trying to answer with your infographic.
Think of how illustrations work in a children’s book. The same should be true for your infographic.
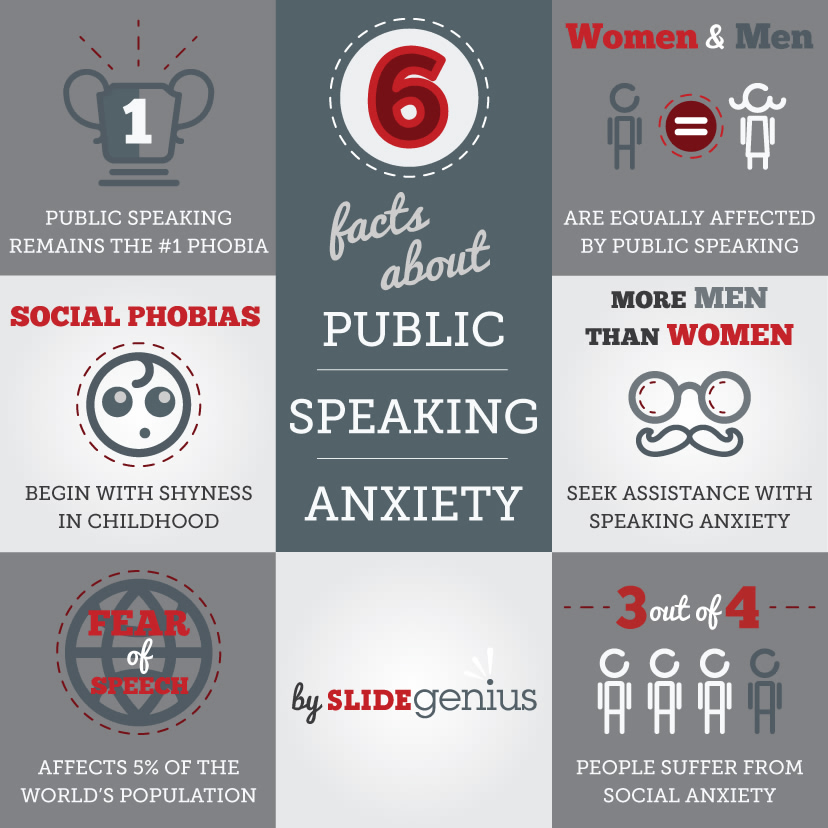
This is an infographic we made on public speaking anxiety:
The Takeaway: Give it One Last Look
Before you place it on your PowerPoint presentation or post it online, give your infographic one last look. Ask yourself if the information you presented are sufficient enough to finish the story you’ve set out to tell.
More importantly, check to see if it feels too cluttered or awkward on the eyes. Trim some design details and even some unnecessary data if you have to.
References
“9 Awesome Reasons to Use Infographics in Your Content Marketing.” Jeff Bullas Blog. March 07, 2012. Accessed July 07, 2014.
Video Infographic – Your Brain on Visualization. Kissmetrics. Accessed July 07, 2014.
Featured Image: GDS Infographics for Meet the Boss TV