
We previously covered tips for designing financial PowerPoint presentations. We mentioned then that you should take the time to curate the data you have on hand, and choose only the ones that will help move your story forward. At the same time, you can’t just present this data as it is. Majority of the population are inclined towards visual learning, and chances are, your audience members are, too.
Make use of visual tools to enhance your presentation. Present the data in your financial PowerPoint through charts, graphs, and other illustrations. Each type has its strengths and weaknesses suited for the type of data you’re presenting.
Choosing how you’ll present the information will depend on its complexity and what it represents. In this post, we’ve come up with a guide explaining the basic ways you can showcase data in your slides.
Here are a few tips on the types of visual data you can use to spice up your slides:
Graphs
For a financial PowerPoint, graphs are best used to show trends and patterns in your data. It’s a great way to illustrate how your market performance has improved throughout time or how the sales of products under your brand compare with each other. There are two common types of bar graphs:

- Line graphs: Use this type of graph for illustrating changes in your data throughout time, like growth or decline in finances.
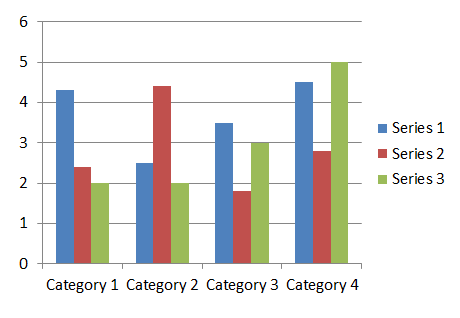
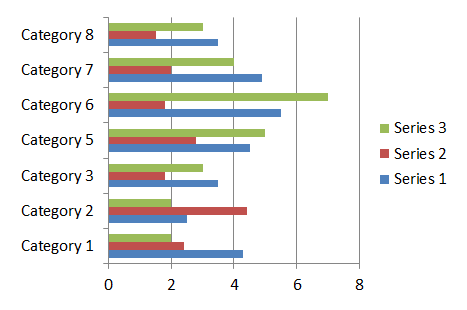
- Bar graphs: Bar graphs are perfect for showing comparisons in the data. Make use of vertical bar graphs if you’re comparing less than 8 different sets of data. Otherwise, go with a horizontal bar graph. This helps compress the information without making it look confusing.
Pie Charts
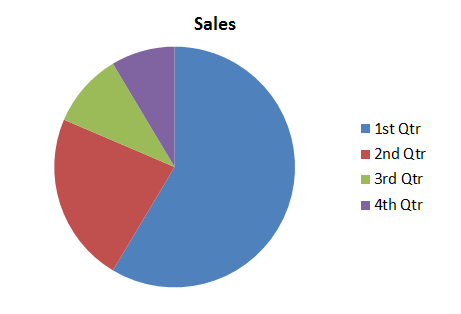
Make use of pie charts if you’d like to illustrate how different numbers correspond to a whole. For example, a pie chart can easily show how your finances are distributed. There are variations of the pie chart, like the donut, or wheel. While this also has a similar function to the pie chart, it’s a matter of preference what you feel would be more effective in conveying your points.
Flowcharts
You can use a flowchart to explain how your data was gathered, or any other important process that is pertinent to your financial PowerPoint presentation. A flowchart visualizes steps or procedures through a progression of shapes.
Other Illustrations
There are other types of diagrams you can make use of in visualizing your data. This abundance of types can be narrowed to two of the more common kinds:
- Venn diagrams: Used to showcase the relationship between different sets of data.

- Maps: If you want to show data that corresponds to a specific location. This is great for illustrating statistics gathered from market surveys and the like.
Data is definitely an important element of financial PowerPoint presentations. When translating numbers into illustrations, take note of these pointers and consider the rules of presentation design.
Reference
“Present your data in a doughnut chart.” Office Blogs. Accessed June 20, 2014.


