
Sheer panic—that’s probably your first reaction when you realize that you couldn’t save the PowerPoint file you were working on. Maybe the power went out, or your computer unexpectedly crashed. Perhaps you were too preoccupied that you didn’t think to hit “Save.” Whatever the reason, you’ve suddenly lost hours of hard work and have no clue how to get it all back.
Luckily, there’s no reason to stress over losing an unsaved PowerPoint file. Using the latest versions of PowerPoint, you can easily retrieve and recover all your hard work. Follow these steps to recover a PowerPoint file you accidentally lost:
Need a Presentation Designed?
Click Here To View Our Amazing Portfolio!
Method One: Recover Unsaved Presentations
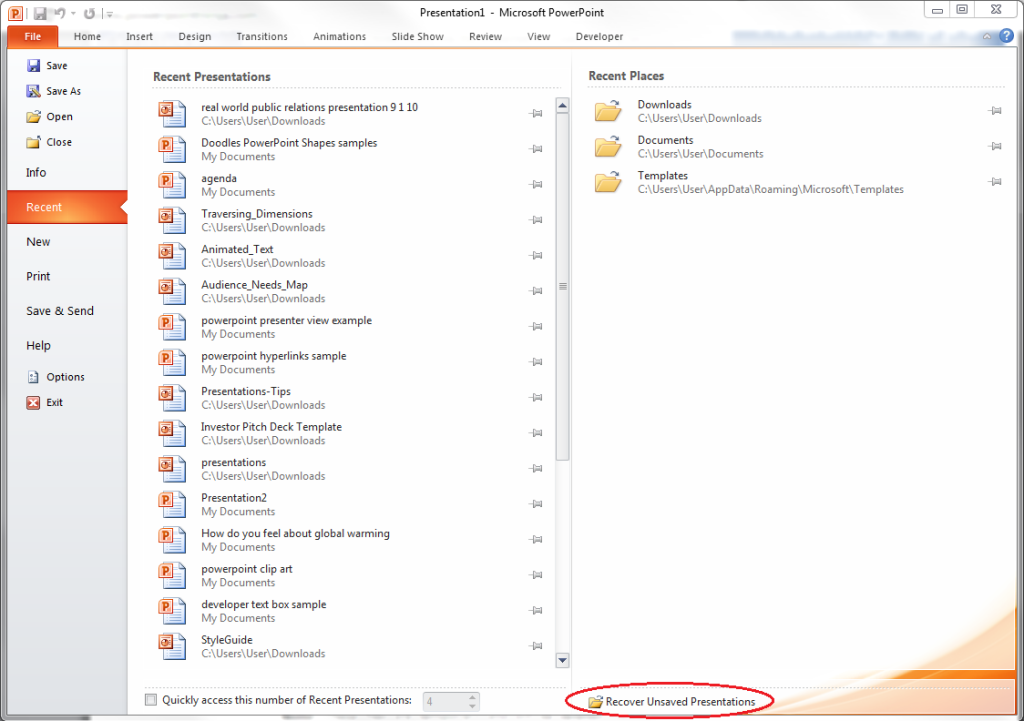
If you were interrupted before saving your PowerPoint file, you could simply look for it in the Microsoft Unsaved Files folder. Go to the File tab, make sure you’re on Recent, and click on Recover Unsaved Presentations. The icon is right below the list of folders under Recent Places.
Everything in the Unsaved folder is a temporary file. Make sure you recover and save everything you need because you might lose it after a few days.
Method Two: AutoRecover
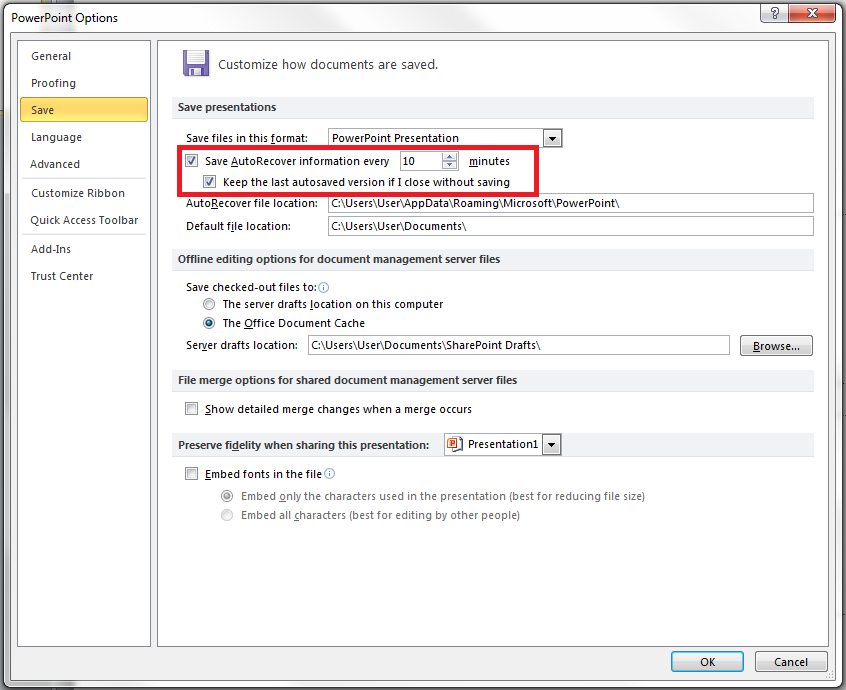
If you’ve been periodically saving your work but was interrupted before you could save specific changes, you can retrieve your PowerPoint file using the AutoRecover function. First, check if you have it enabled. Go to the File tab, click on Options and go to Save. Make sure your options are similar to those in this picture:
If you don’t have AutoRecover enabled, there’s no other way to retrieve the changes you made to your PowerPoint file. You will have to redo your work from the last save. But if everything looks good, you can then follow these steps:
1.) Copy the file destination path in the same dialogue box.
![]()
2.) Open Windows Explorer, paste the path on the address bar, and hit Enter.

To avoid losing crucial information, ensure AutoRecover is enabled every time you create a PowerPoint deck.
Need a Presentation Designed?
Click Here To View Our Amazing Portfolio!
Conclusion

Retrieving an unsaved PowerPoint file is a no-brainer as long as you know these basic recovery methods.
You can either open the “Recover Unsaved Presentations” found in the “Recent Places” or use the AutoRecover function to check where that unsaved document must be hiding.
Learn these tricks by heart so you don’t have to worry about getting your presentation back!


